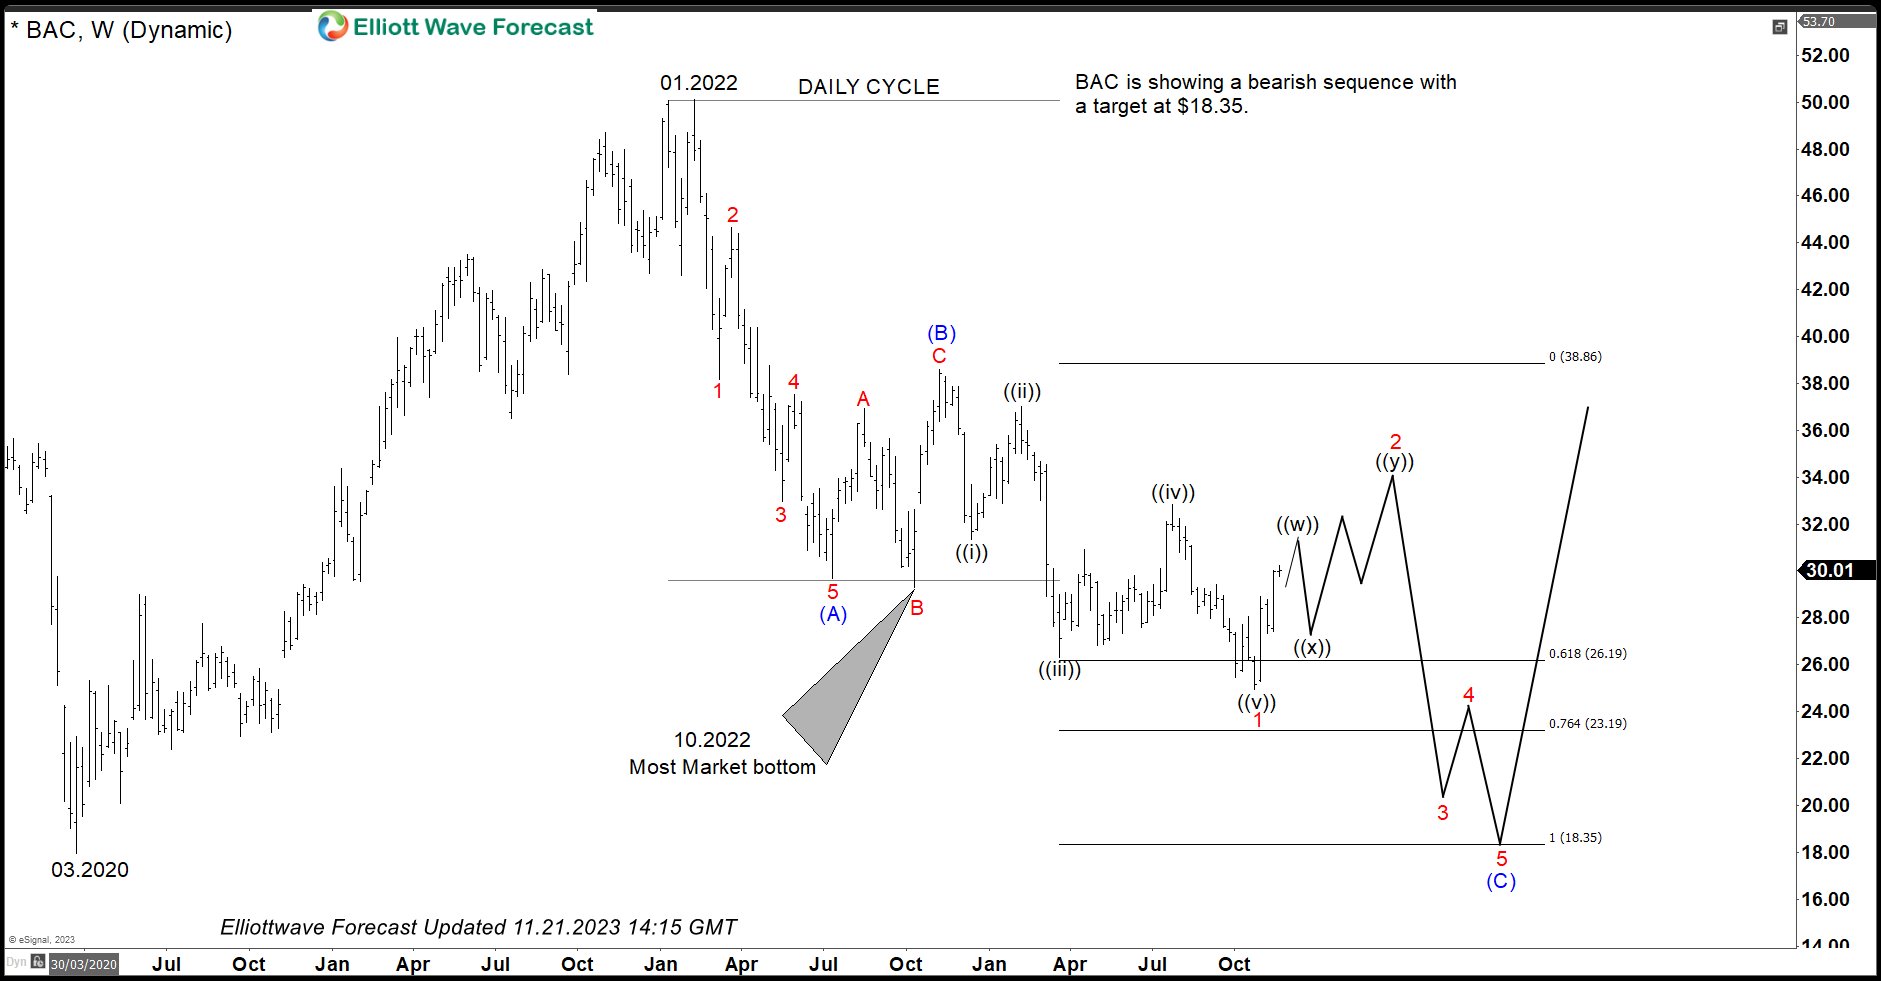
We will look at the bearish sequence in BAC (Bank of America) and present two views that are slightly different in terms of the extent of the bounce but both are calling for an extension lower. We will also look at the area that can act as a floor for BAC and where buyers should appear to resume the rally for the next long-term rally or produce 3 waves bounce at a minimum.
Bank of America Elliott Wave Sequence
The chart below is the weekly chart of Bank of America (BAC) and it shows an incomplete bearish sequence down from the January 2022 peak against the November 2022 peak. The initial decline from the January 2022 peak was in 5 waves which ended at $29.67 and wave (B) ended at $38.86 as a 3-3-5 FLAT correction. BAC has since then made a new low below $29.67 July 2022 low which created an incomplete bearish sequence and has opened an extension lower. Decline from (B) high is in 5 swings so as bounces fail below (B) high, expect more downside toward $18.35 – $13.51 area to complete the sequence from January 2022 peak and then BAC stock should turn up to resume the rally or put in a larger 3 waves bounce at least.
Bank of America (BAC) Extended Bounce View
The chart below shows the idea of an extended bounce in 7 swings before the decline resumes. $31.39 – $33.92 is the area to end 3 swings up from the low and from this area, stock could resume the decline for a new low or it could pull back in 3 waves and then do another 3 swings higher to complete 7 swings up from the low. In either case, as bounces fail below (B) high, expect more downside to take place.

Source: https://elliottwave-forecast.com/video-blog/bank-of-america-bearish-sequence/

