
$USDMXN has been trading lower since the peak at 04.2020. We have been waiting for the area between $15.98-$12.14 to be reached. The pair is important because of the correlation with the $USDX and the implication across the Market. Here is the Weekly chart for the pair and the $USDX showing the correction and the cycle since 2020.
Correlation of $USDX and $USDMXN
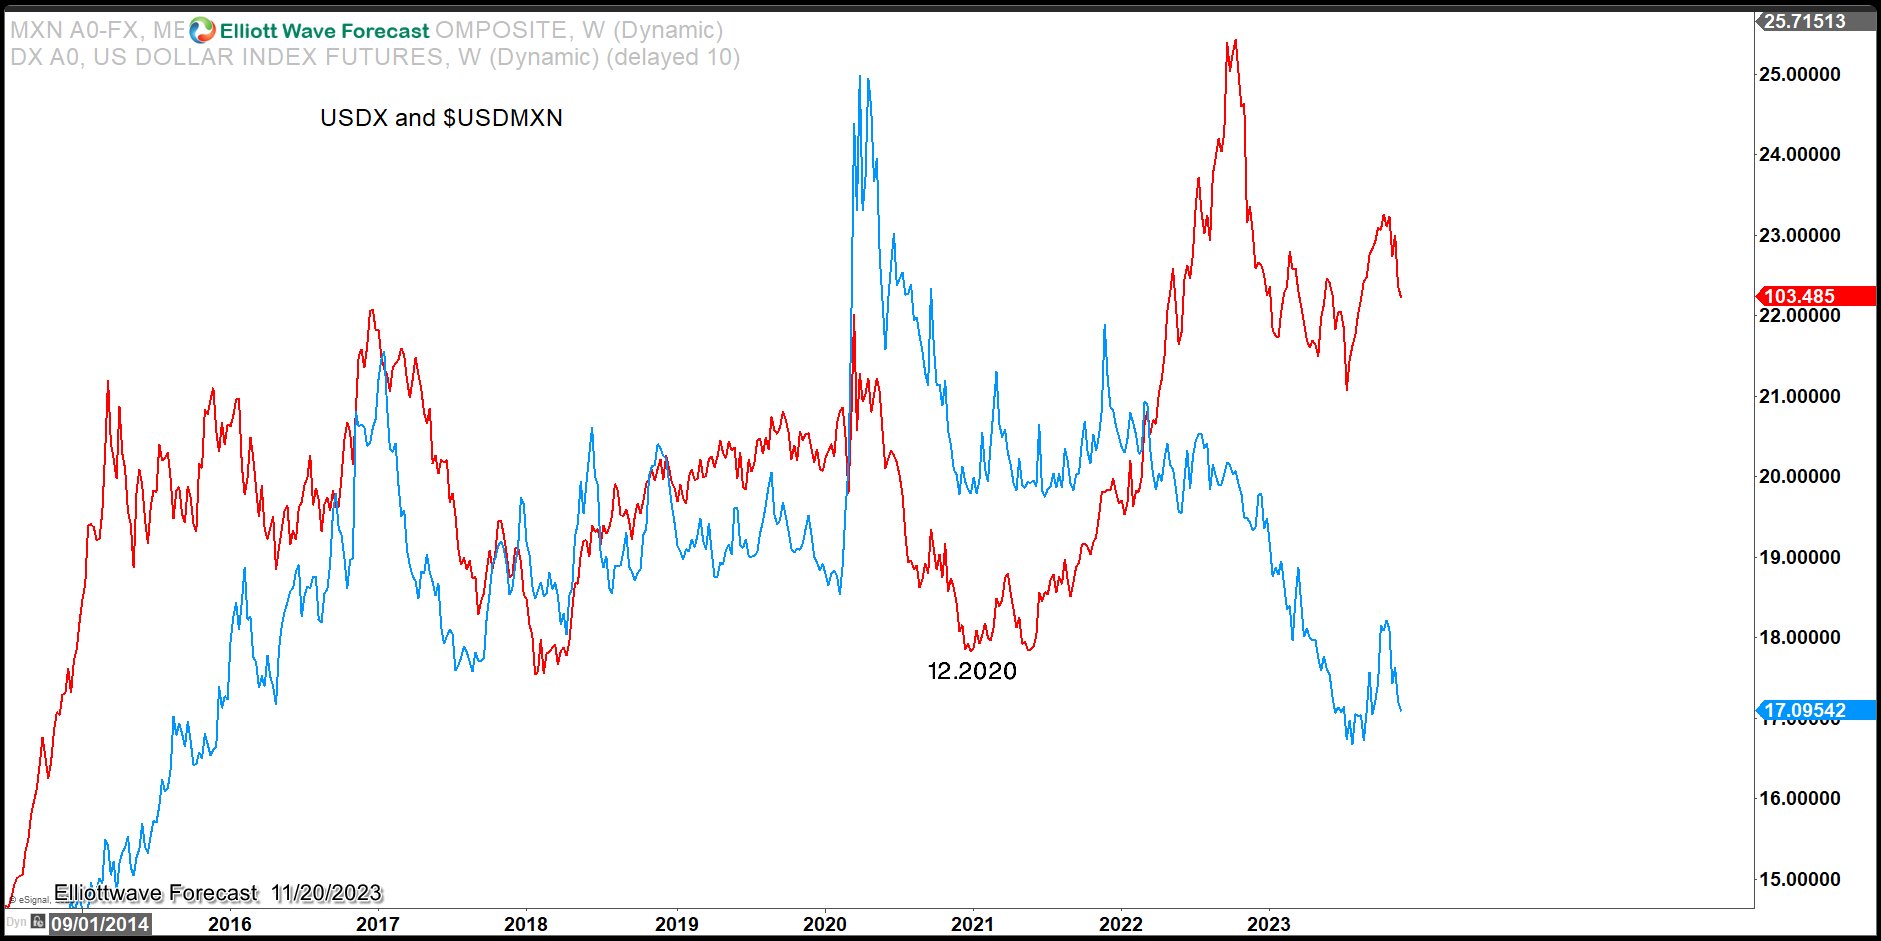
Weekly chart of the 2 instrument above shows the decline as simple zigzag. Zigzag or ABC is a 5-3-5 structure. Each leg comes in a subdivision of 5 waves. We at EWF believe the market has turned into a High-Frequency market, as explained in the following article. We are expecting the instrument to bounce in three waves from the target blue box area as the following chart shows
$USDMXN Weekly Elliott Wave Chart
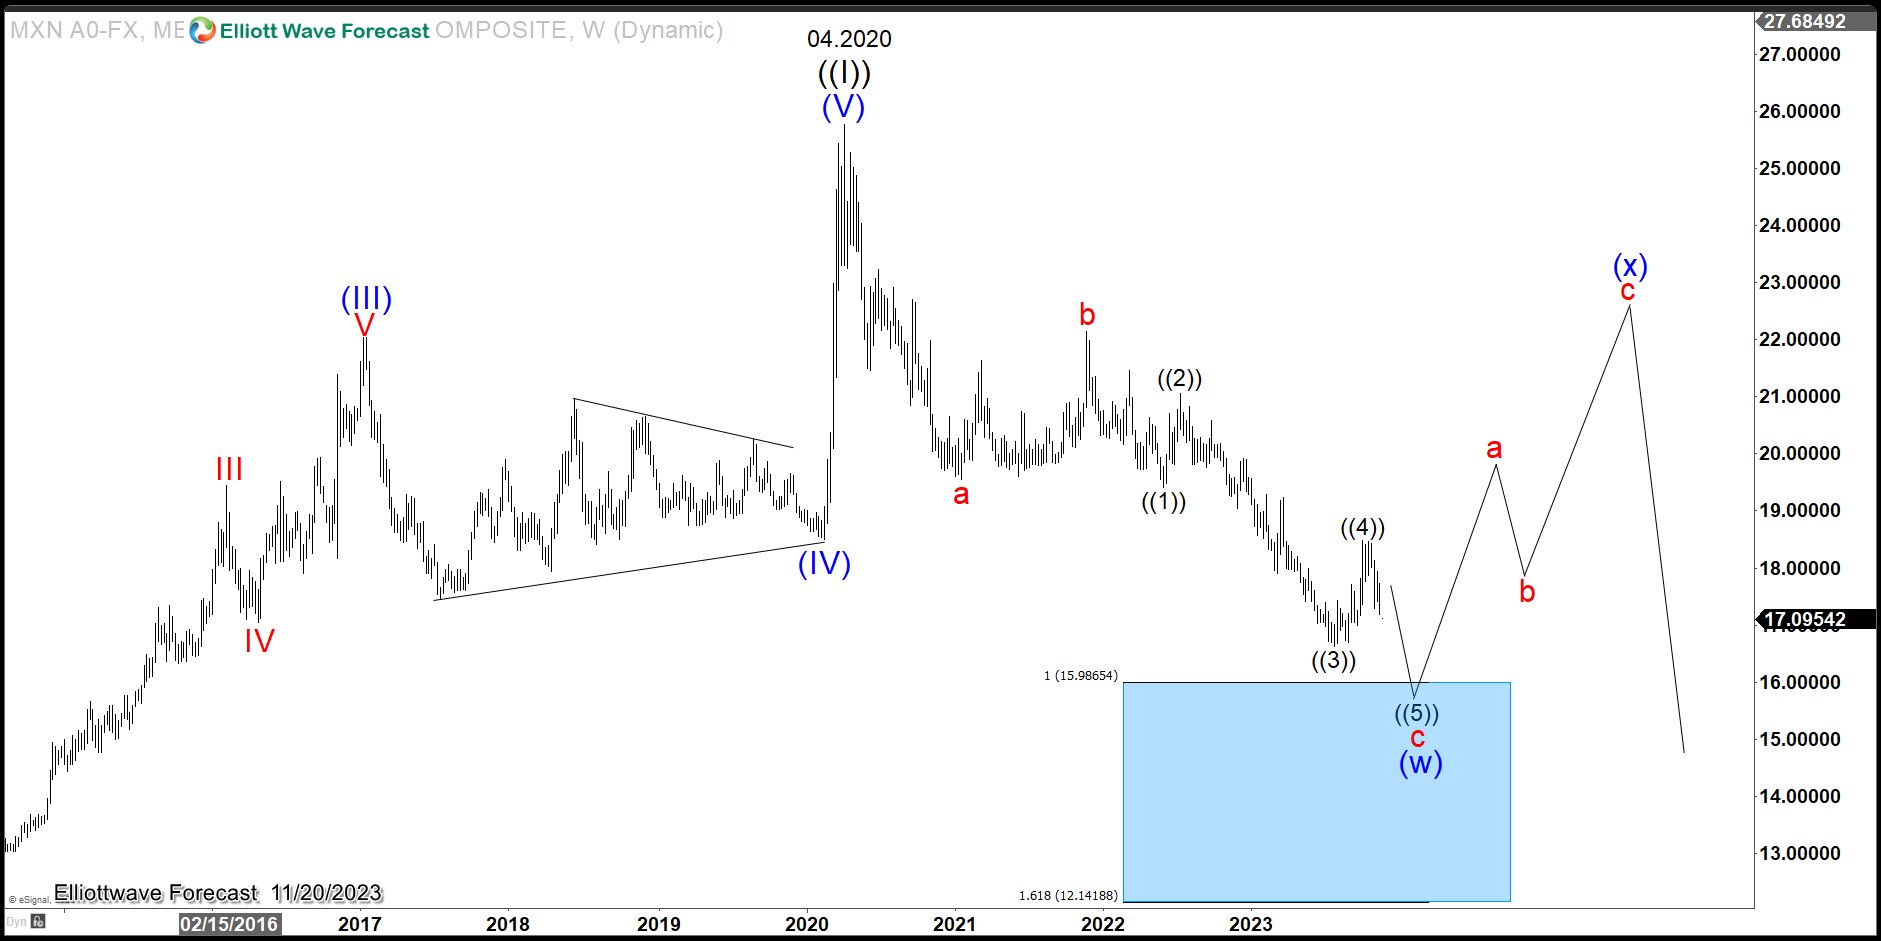
The $USDMXN weekly chart above shows the decline to the area we highlighted as a Blue Box. This area provides at least a bounce or a reaction 85% of the time. As we can see, the pair should be trading within wave ((5)) of c. Currently, it might be ending the first leg of wave ((5)). The path of $USDMXN will make the $USDX lower and supports the Indices higher, as this is the Market dynamic and correlation.
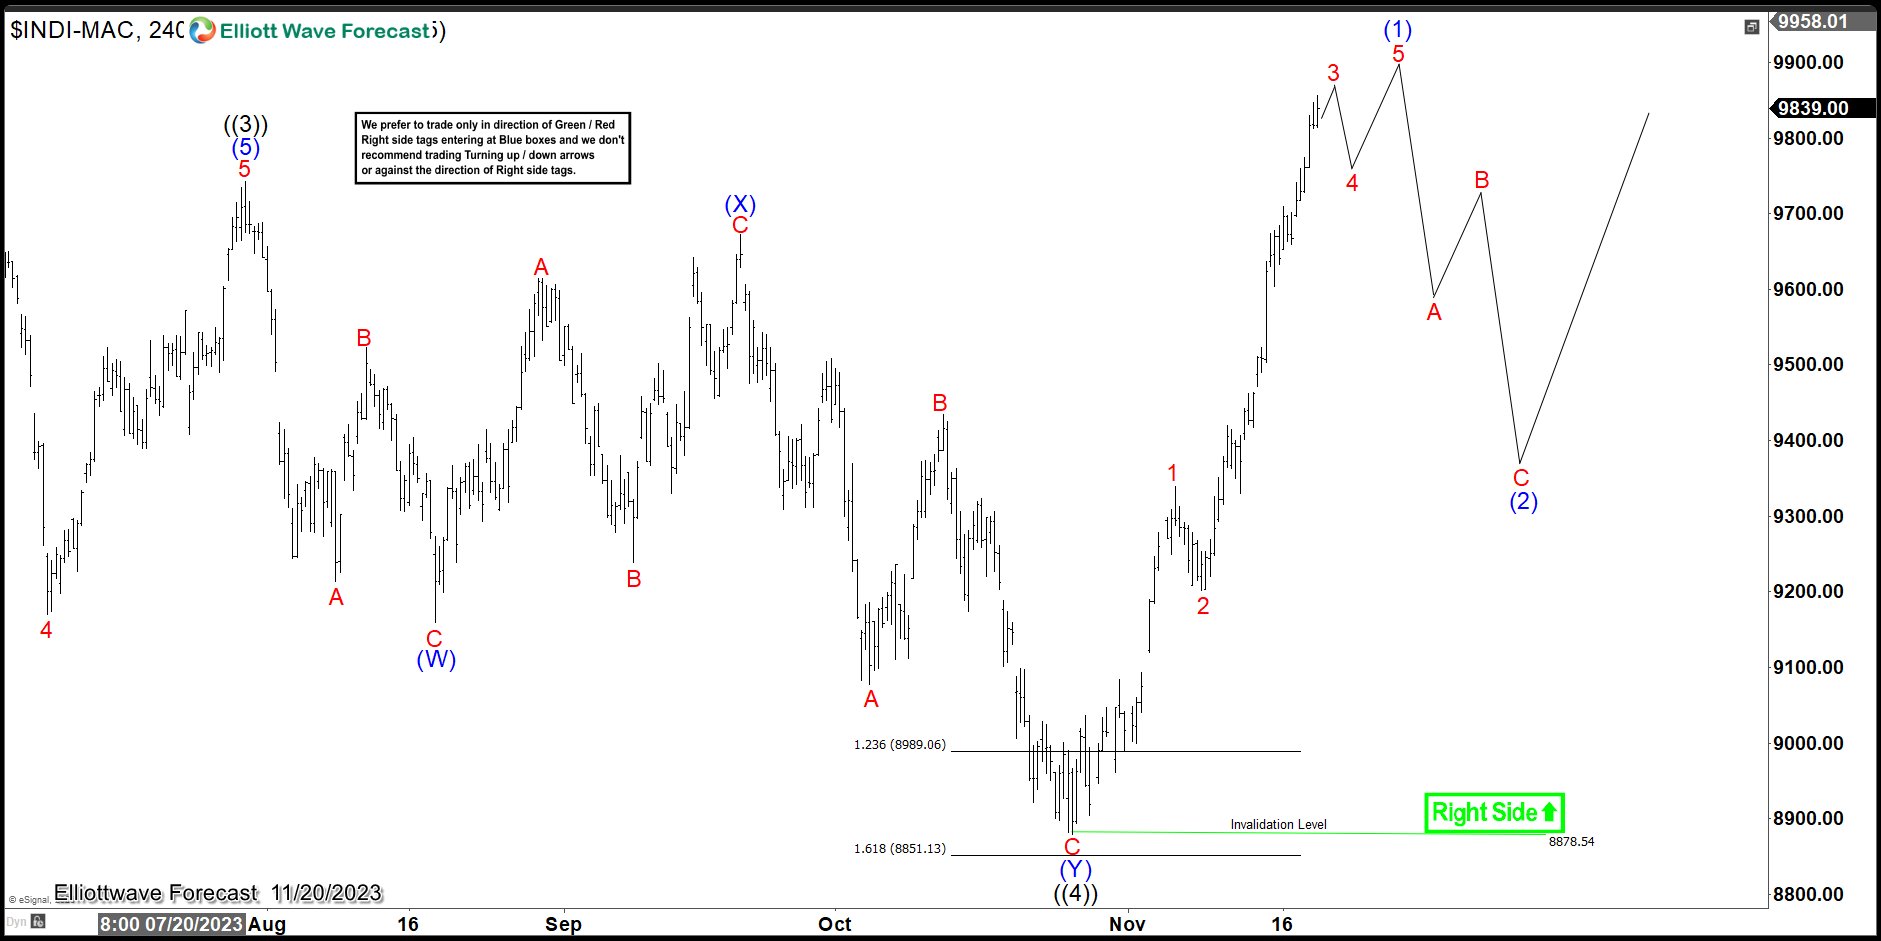
$USDMXN 4 Hour Elliott Wave Chart
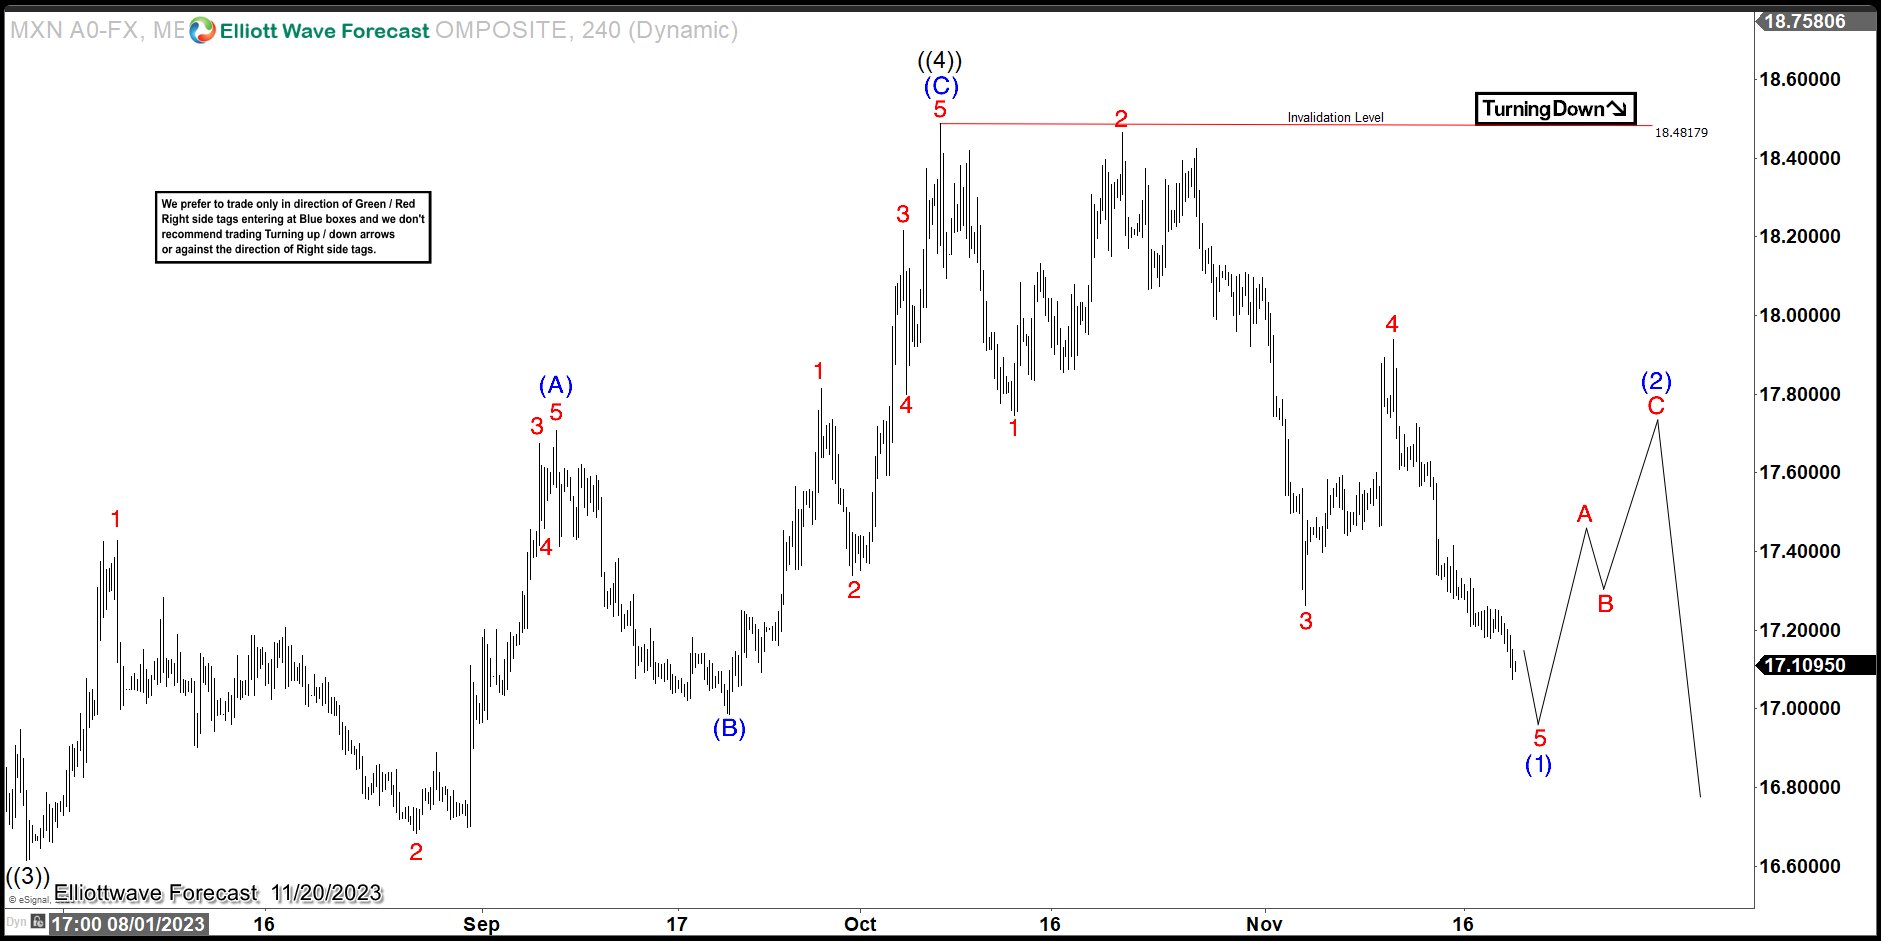
The 4 hour chart above shows wave (1) of ((V) since the peak. The chart reveals a five-waves decline since the peak at 10.06.2023. Even when a three waves pullback soon should happen, more downside should play out afterwards. It confirms our view of more downside into the Blue Box in the higher time frame. As we always do at EWF, we use correlation to pick the most realistic path even when five waves can be seen in some Indices, Stocks, and ETFs since the lows of 03.2020. Here is an example of an Index showing five waves off the lows at 03.2020. The IBEX35, the Index from Spain, shows a clear five-wave advance off the lows, as shown in the following chart
$IBEX35 Weekly Elliott Wave Chart
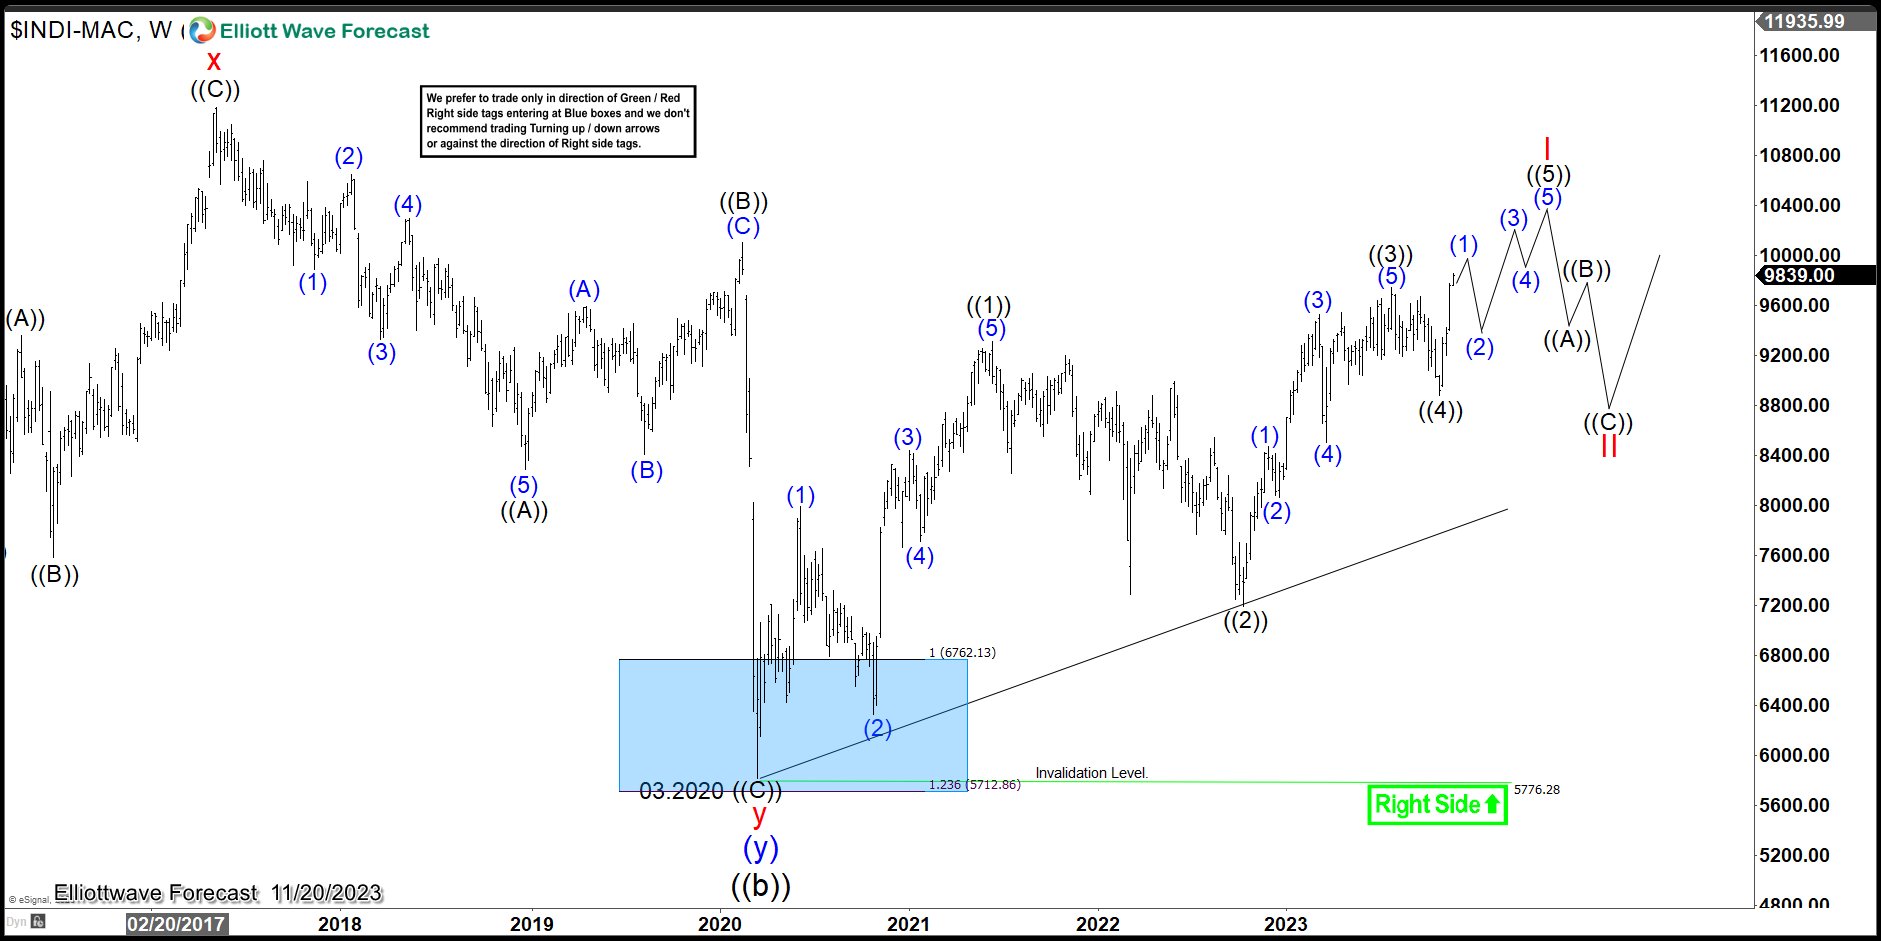
The weekly chart of $IBEX above shows a 5 waves rally from 03.2020 low. As mentioned above, we can label the Ibex35 completed, but looking at $USDMXN, it is safe to say that more upside within wave ((5)) should happen in the Index. The following chart shows the Ibex35 off the lows
$IBEX35 4 hour Elliott Wave Chart
The 4 hour chart of IBEX above shows an impulse since the low 10.26.2023. This is in total agreement with the $USDMXN. Looking at $USDMXN, we should call the advance of Ibex35 as wave (1) of ((V)). This will form a perfect alignment across the Market.
$USDMXN and $IBEX35 Correlation
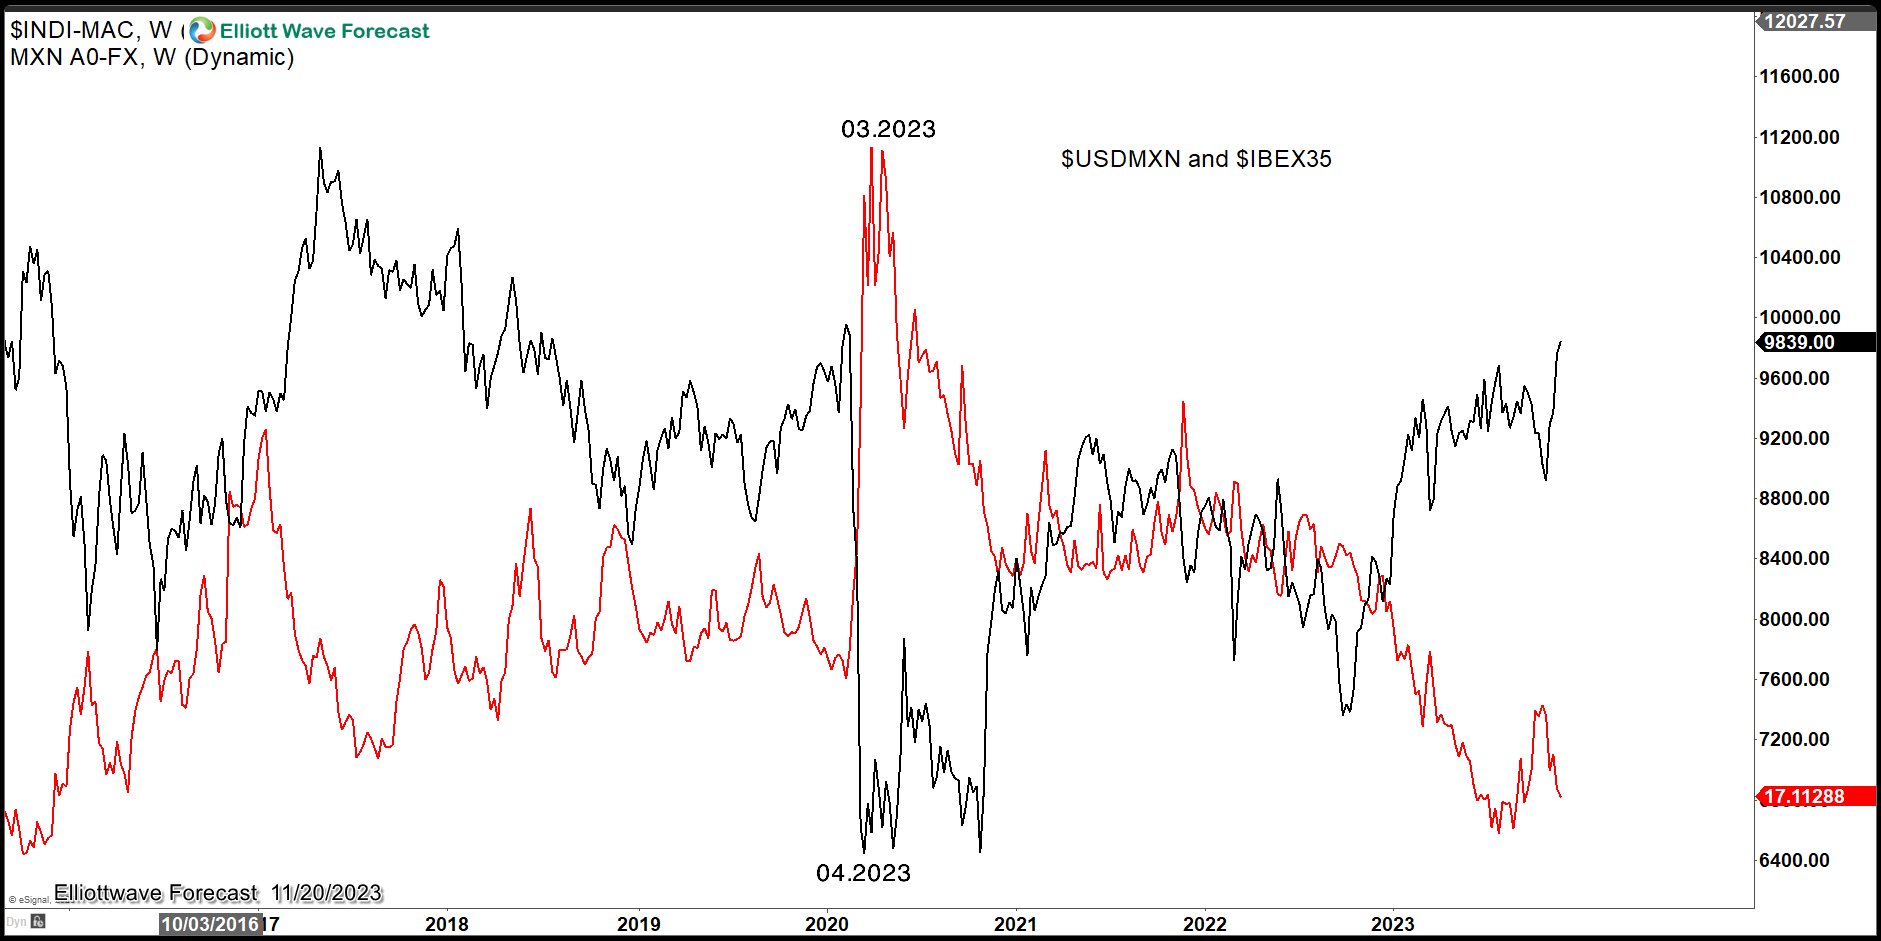
The chart above shows an overlay between $IBEX35 and $USDMXN. It offers a complete agreement in both instruments since 03.2020 low. Our expectation is a continuation of this correlation. We do also understand that a bounce off the $USDMXN off the Blue Box will place World Indices at a risk of a correction. Thus, year 2024 can end up being a very interesting year for the USDX and also the Indices.
Source: https://elliottwave-forecast.com/stock-market/usdmxn-the-instrument-and-the-world-indices/