
The Global X Uranium ETF (URA) is an exchange-traded fund (ETF) that focuses on companies in the uranium industry. ETFs are investment funds that trade on stock exchanges. They typically aim to track the performance of a specific index or sector. URA provides investors with exposure to companies involved in the exploration, mining, and processing of uranium. This can include uranium miners, nuclear power plant operators, and companies involved in the production of nuclear fuel.
$URA Elliott Wave Chart Monthly Chart
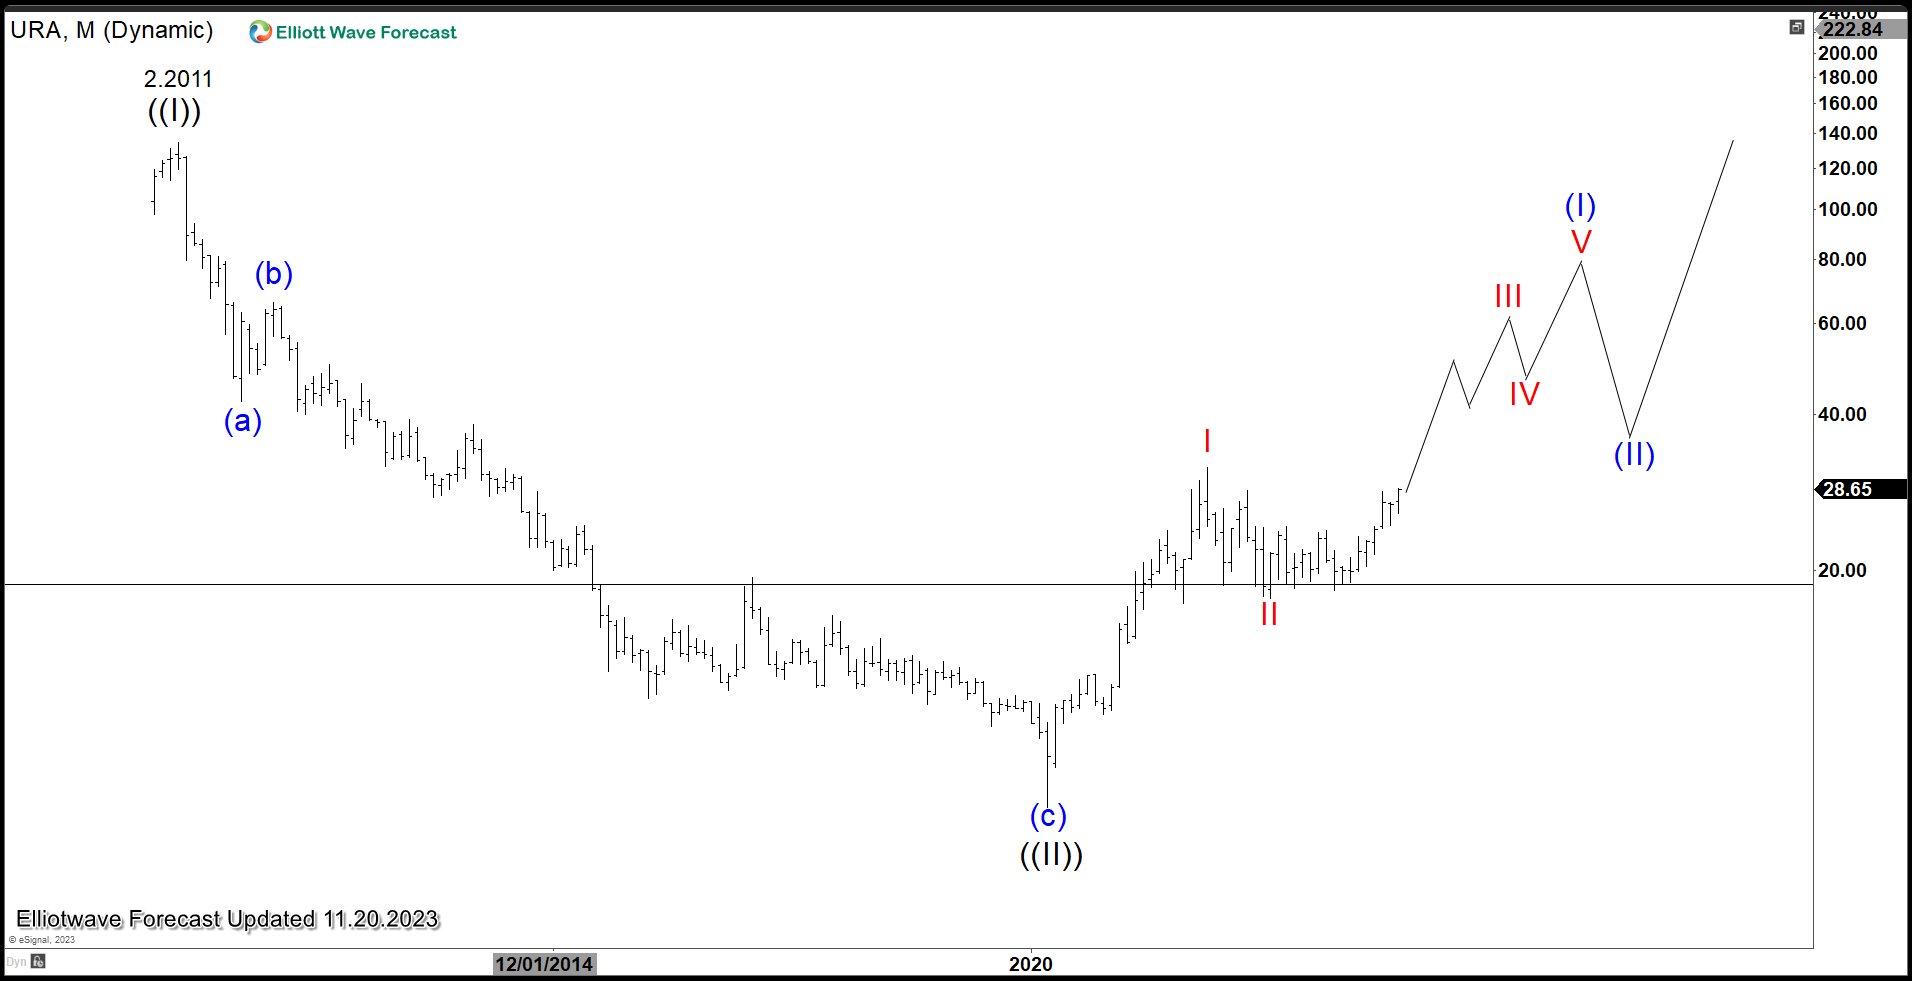
Uranium ETF (URA) Monthly Chart shows that it ended wave ((II)) at 6.95. Up from wave ((II)), wave I ended at 31.6 and pullback in wave II ended at 17.65. It has turned higher and about to break above wave I which should validate the bullish view and opens a bullish sequence from March 2020 low. Break above wave I should open up more upside to 100% – 161.8% Fibonacci extension of wave I towards 42.5 – 57.9 area.
$URA Daily Elliott Wave Chart
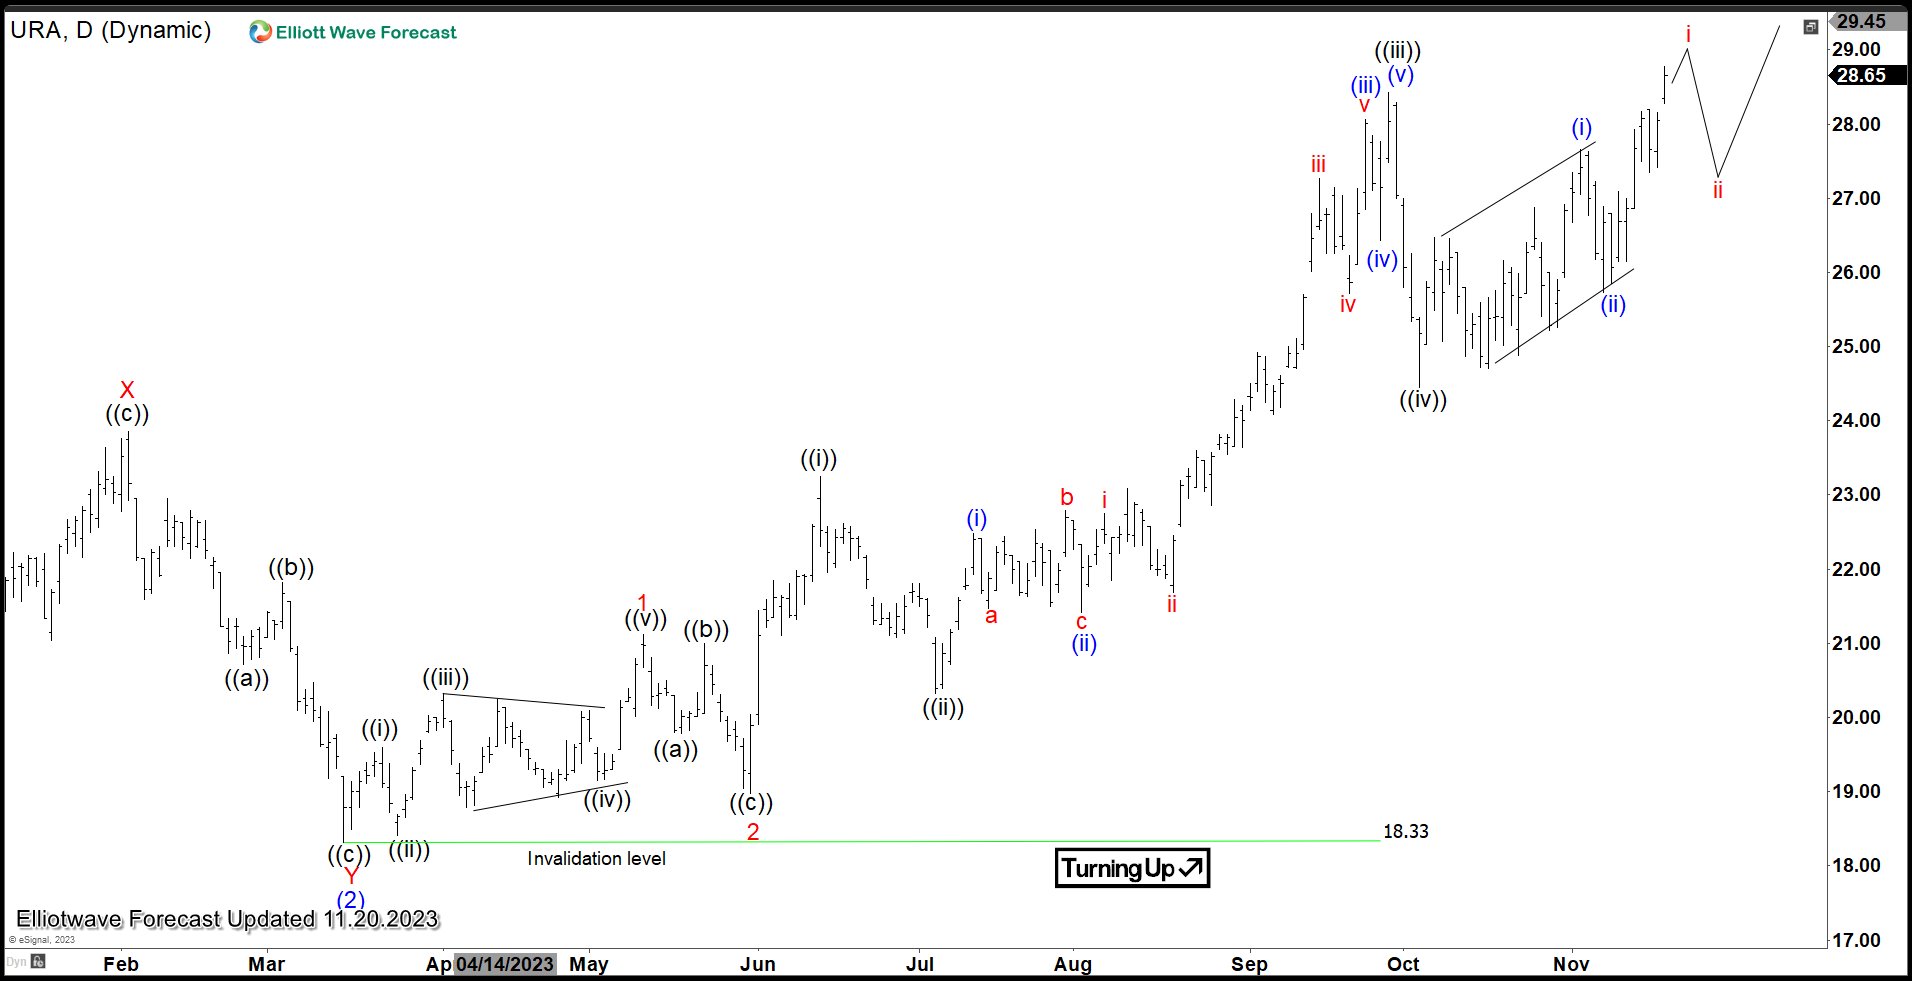
In Daily Elliott Wave Chart of $URA above, the ETF has ended wave (2) at 18.33 and turns higher in wave (3). Internal subdivision of wave (3) is unfolding as a nest. Up from wave (3), wave 1 ended at 21.12 and dips in wave 2 ended at 18.97. The ETF extends higher again in wave 3. Up from wave 2, wave ((i)) ended at 23.25 and pullback in wave ((ii)) ended at 20.32. The ETF extended higher in wave ((iii)) towards 28.42 and pullback in wave ((iv)) ended at 24.45. Expect the ETF to extend higher and dips to find support in 3, 7, or 11 swing against 18.33 low.
Source: https://elliottwave-forecast.com/stock-market/uranium-etf-ura-bullish-cycle-progress/