
In this article, we’re going to take a quick look at the Elliott Wave charts of ES_F (E-mini S&P 500) published in the members area of the website. As our members know, E-mini S&P500 is trading within the cycle from the October 13, 2022 low (3502). The rally so far is in 3 waves but has scope to become 5 waves as far as the price stays above the recent low of October 4, 2023. Recently we got 3 waves pull back which found buyers right at equal legs area as we expected. In the further text, we are going to show how all this unfolded and the reaction higher which took place from the equal legs area.
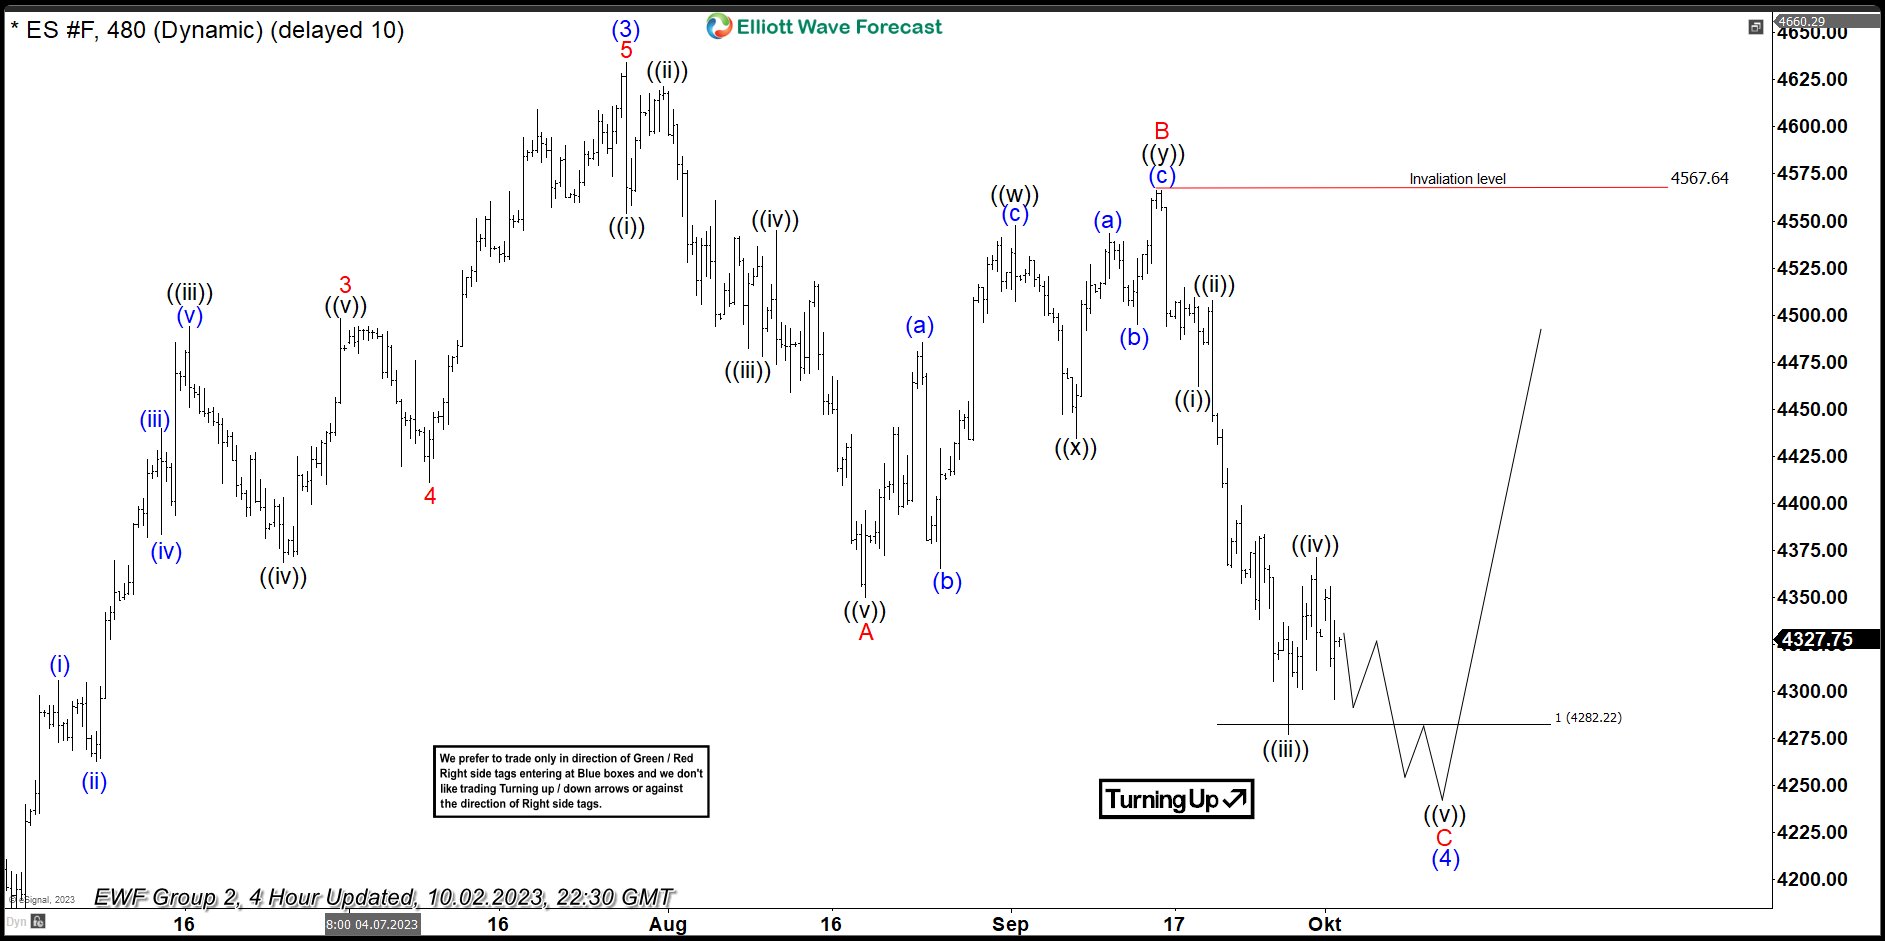
ES_F 2 October 2023, 4 Hour Elliott Wave Update
ES_F made a pullback in 3 waves and reached the extreme zone- equal legs area starting from 4282.22. ES_F has already reached the extreme area and 3 waves pull back could be counted completed but the chart below favors the idea of another leg lower within the equal legs area as wave ((v)) of C before a reaction higher takes place. This should allow the rest of the Indices to reach their respective extreme areas. After another low, ES_F should ideally find buyers for further rally in wave (5) blue or for a 3 waves bounce at least.
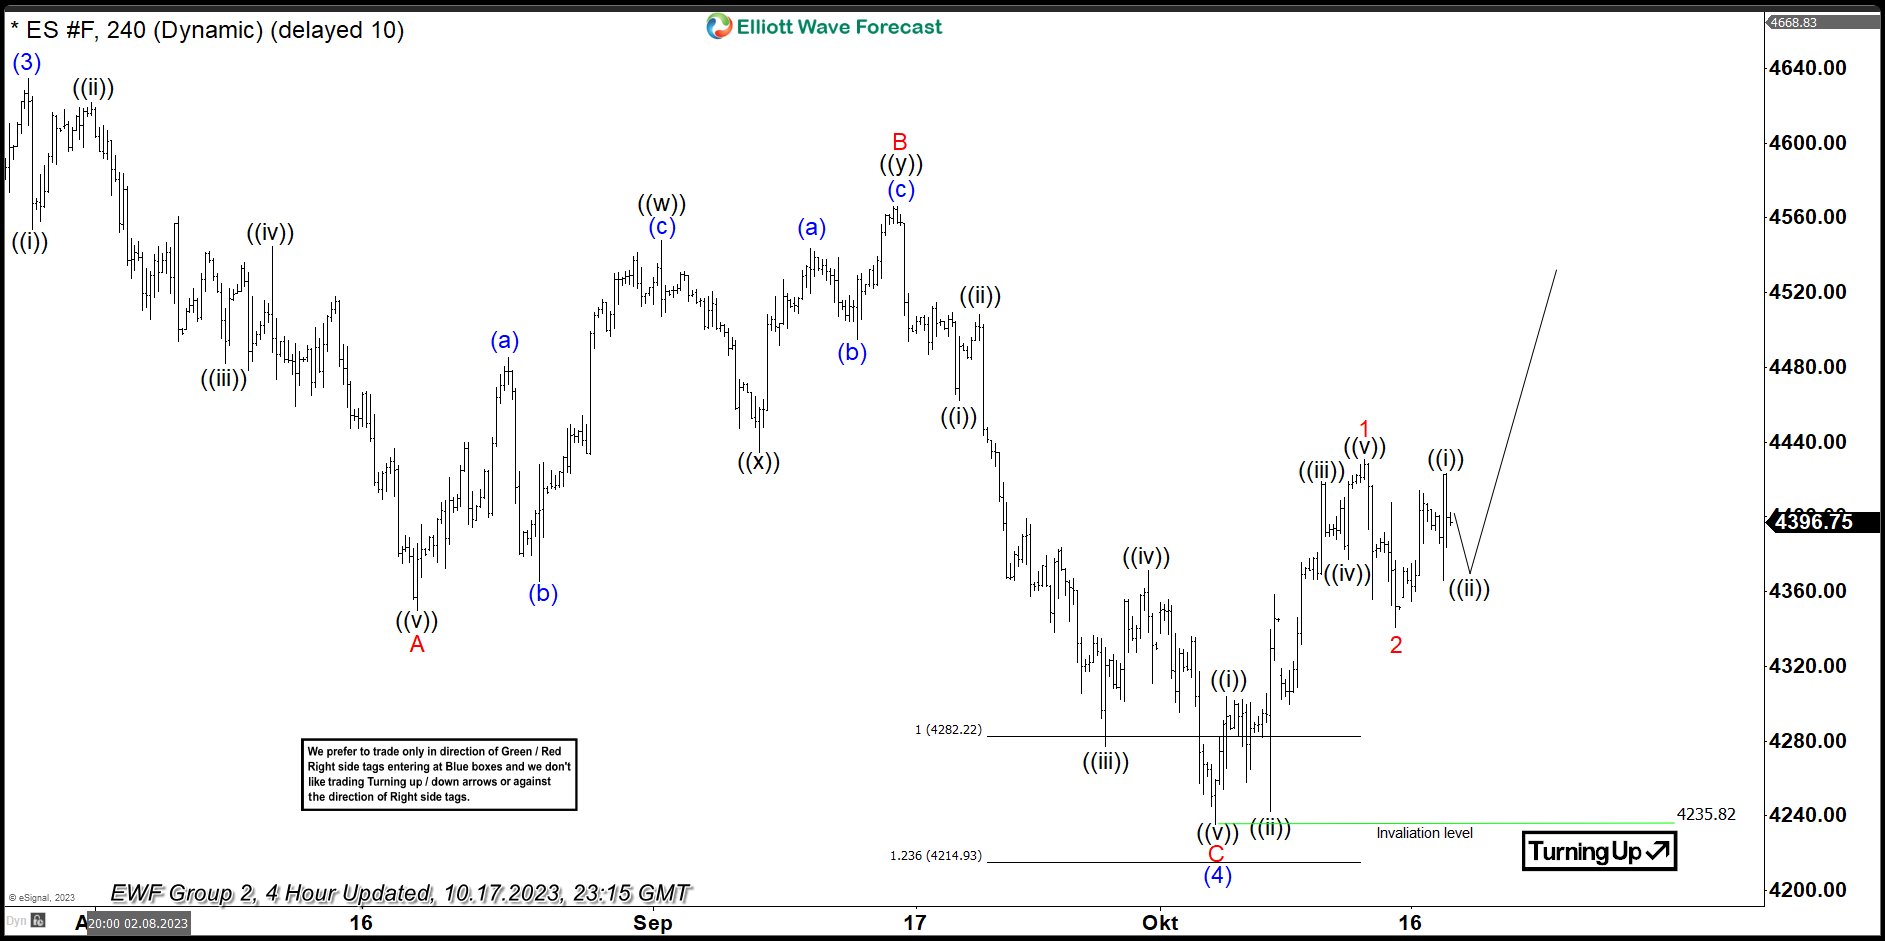
ES_F 17 October 2023, 4 Hour Elliott Wave Update
Buyers appeared at the marked extreme zone between 4282 – 4214 and we are getting good reaction from there. As far as 4235.82 low holds, ES_F should ideally keep trading higher in wave (5) red toward new highs. We need to see break of 07/27 peak to confirm next leg up is in progress.
Keep in mind that the market is dynamic and the presented view could have changed in the meantime. You can check most recent charts in the membership area of the site. Best instruments to trade are those having incomplete bullish or bearish swing sequences
Source: https://elliottwave-forecast.com/video-blog/es_f-reaction-from-equal-legs-area/