
The 10-year Treasury Bond shows an interesting pattern since the all-time lows. A trader or investor needs to understand bonds market, especially the 10 Years. Due to the ten years maturity, this makes investors enter into a lengthy commitment. Investors track Treasury bond yields (or rates) for many reasons. One of the reasons is because the US government pays the yields as interest for borrowing money via selling the bond. The 10-year Treasury yield is closely watched as an indicator of broader investor confidence.
Since Treasury bonds (along with bills and notes) carry the full backing of the U.S. government, they are viewed as one of the safest investments. This bond also tends to signal investor confidence. The U.S. Treasury sells bonds via auction, and yields are set through bidding. Prices for the 10-year bond drop when confidence is high, which causes yields to rise. This is because investors feel they can find higher-return investments elsewhere and do not need to play it safe. Also, it can be said that when things get into a crisis, many investors look at the 10-year Treasury Bonds as safe heaven due to the US government backing. As always, the fundamentals in trading can be seen in many ways, so at EWF, we always pay attention to the Technical aspect and specifically at the Elliott Wave Theory.
$TNX Monthly Elliott Wave Chart
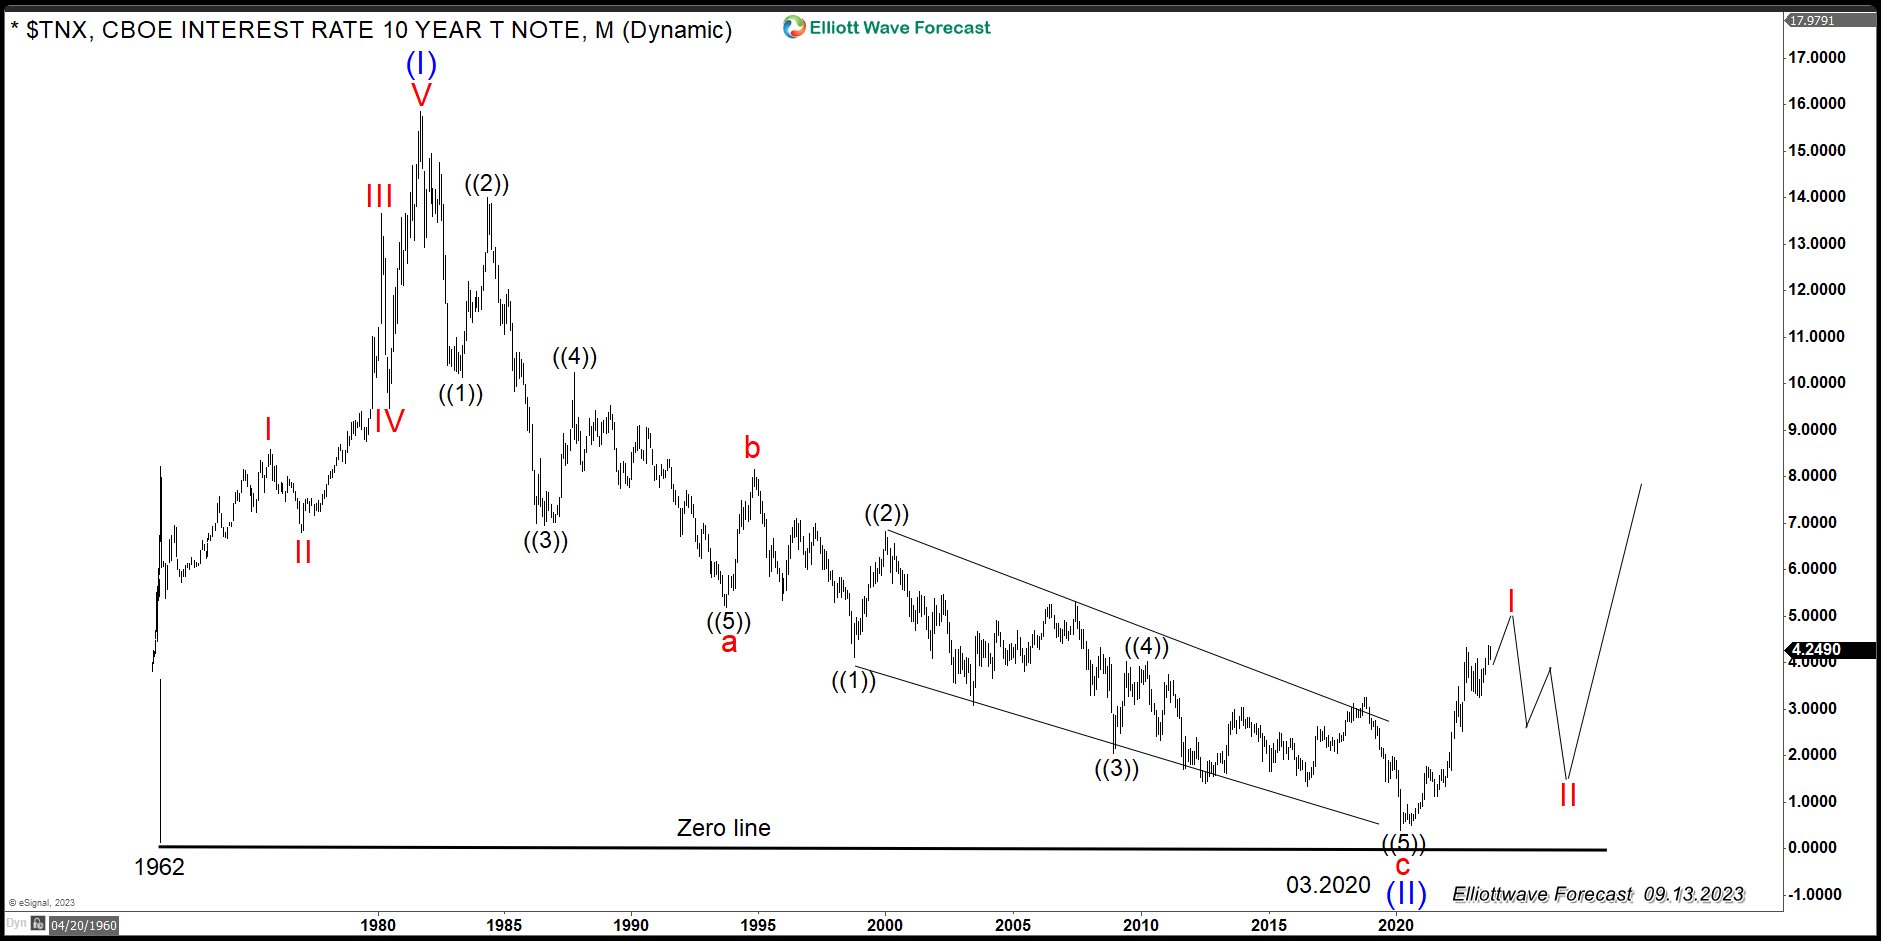
The above chart is monthly data of Ten Year Yields ($TNX) since the all-time lows. We can see how an impulsive rally off the lows ended on September 1981. Following the peak, the instrument sold in big three waves, which ended in 2020 at a rate of 1.1270. Looking at the data, even when bonds can trade below zero, it is hard to see that happening with the US-backed bonds. Therefore, we are assuming the bullish path, which shows the classic Elliott Wave Theory Pattern: five waves followed by three, seven, and eleven waves back. The low on March 2020 can be a major low, which can take the 10-year Treasury Bonds to levels never seen before. Due to the pattern, another leg higher should follow and break the September 1981 peak.
Here is the basic Elliott Wave Theory Pattern
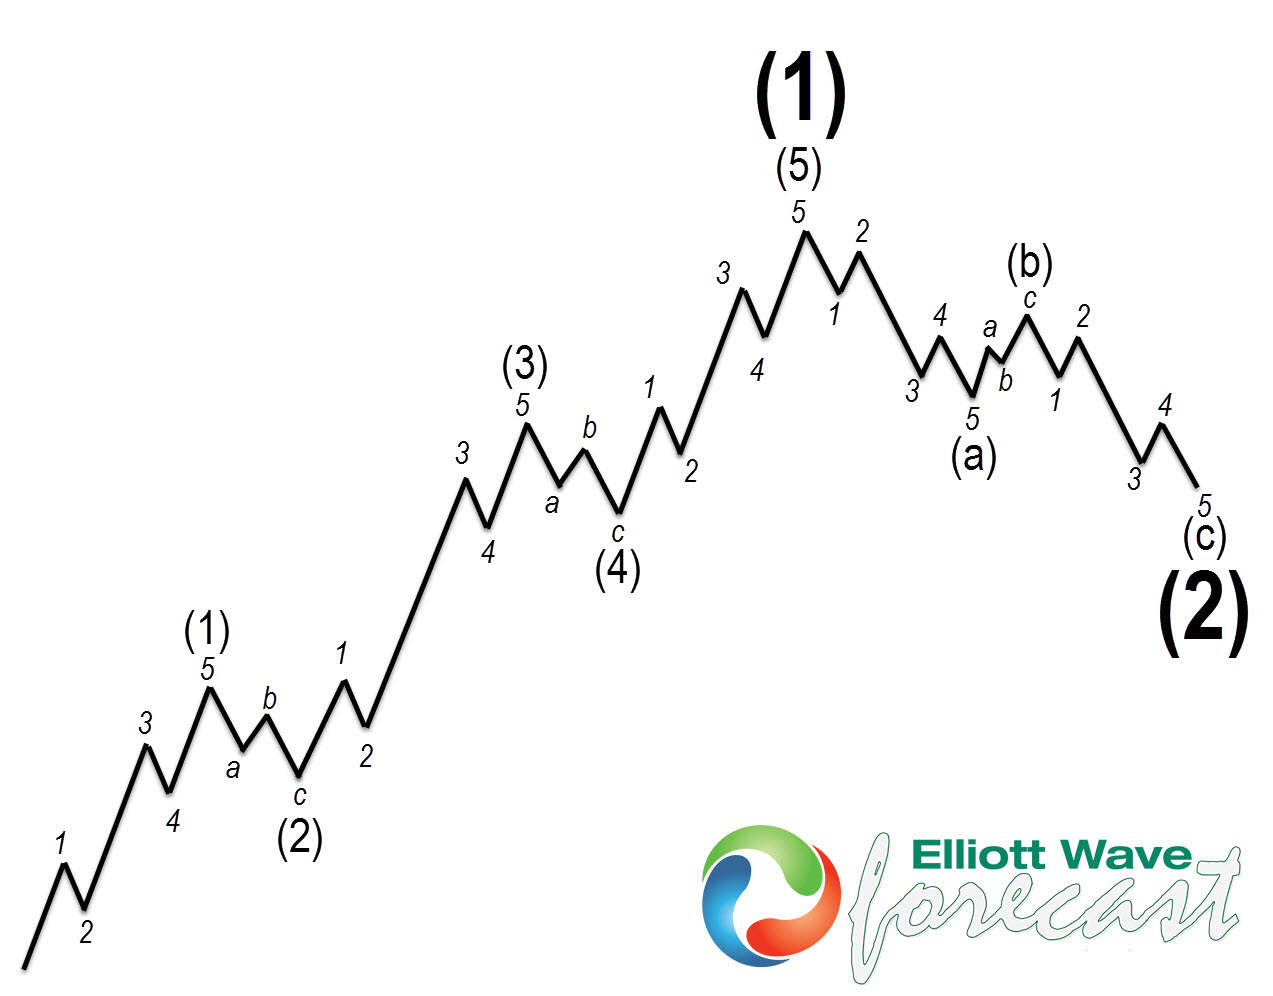
The graph above shows the five waves advance, and each leg subdivides into a lower degree five waves. It is a fractal pattern which repeats in each degree from the Grand Supercycle until the lower degree of the subminute. The chart is clear; each cycle is in five waves, and each pullback in three, but always in the direction of the trend.
$TNX Weekly Elliott Wave Chart
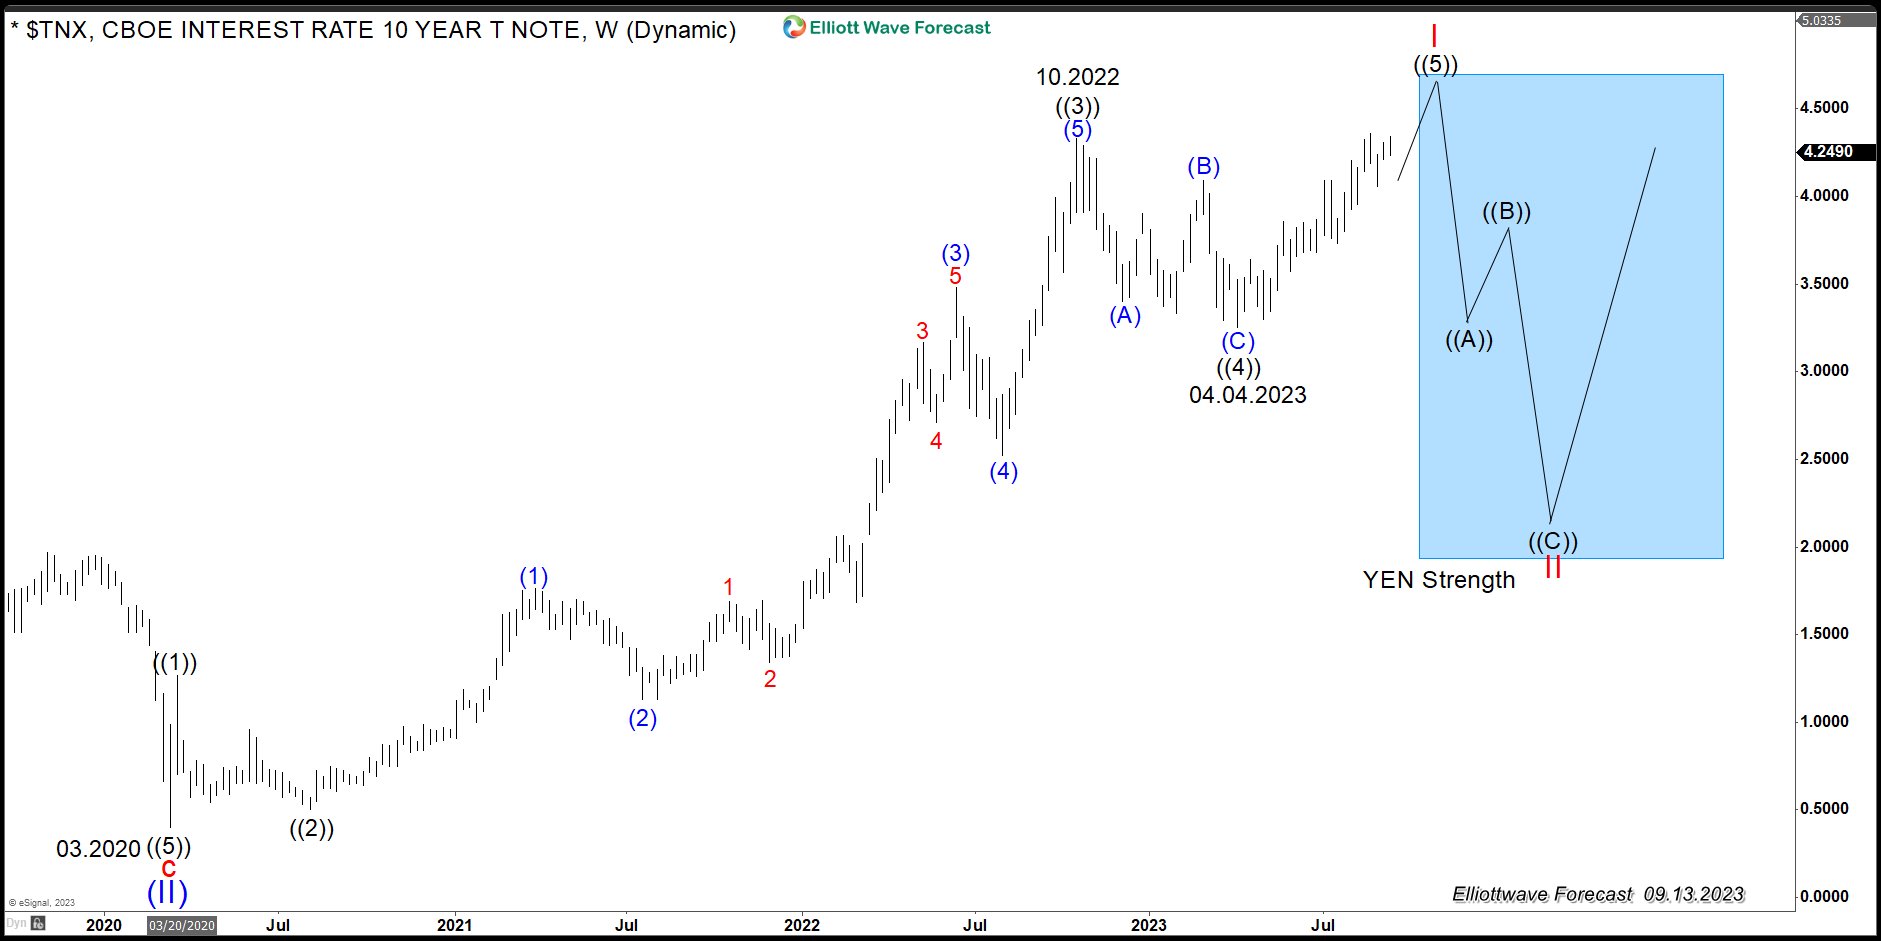
As we have mentioned before, the market moves in a fractal way. So if its advance into the peak on September 1981 was an impulse, then the move off the lows from March 2020, being five waves, goes very well with the monthly bullish idea. As shown on the Weekly chart, an impulse is taking place, which support at least another leg higher, after a three waves pullback. We should be ending that impulse within the latest stages of wave ((5)). Soon, a significant three waves pullback should happen, resulting in lower yields.
$TNX 4 Hour Elliott Wave Chart
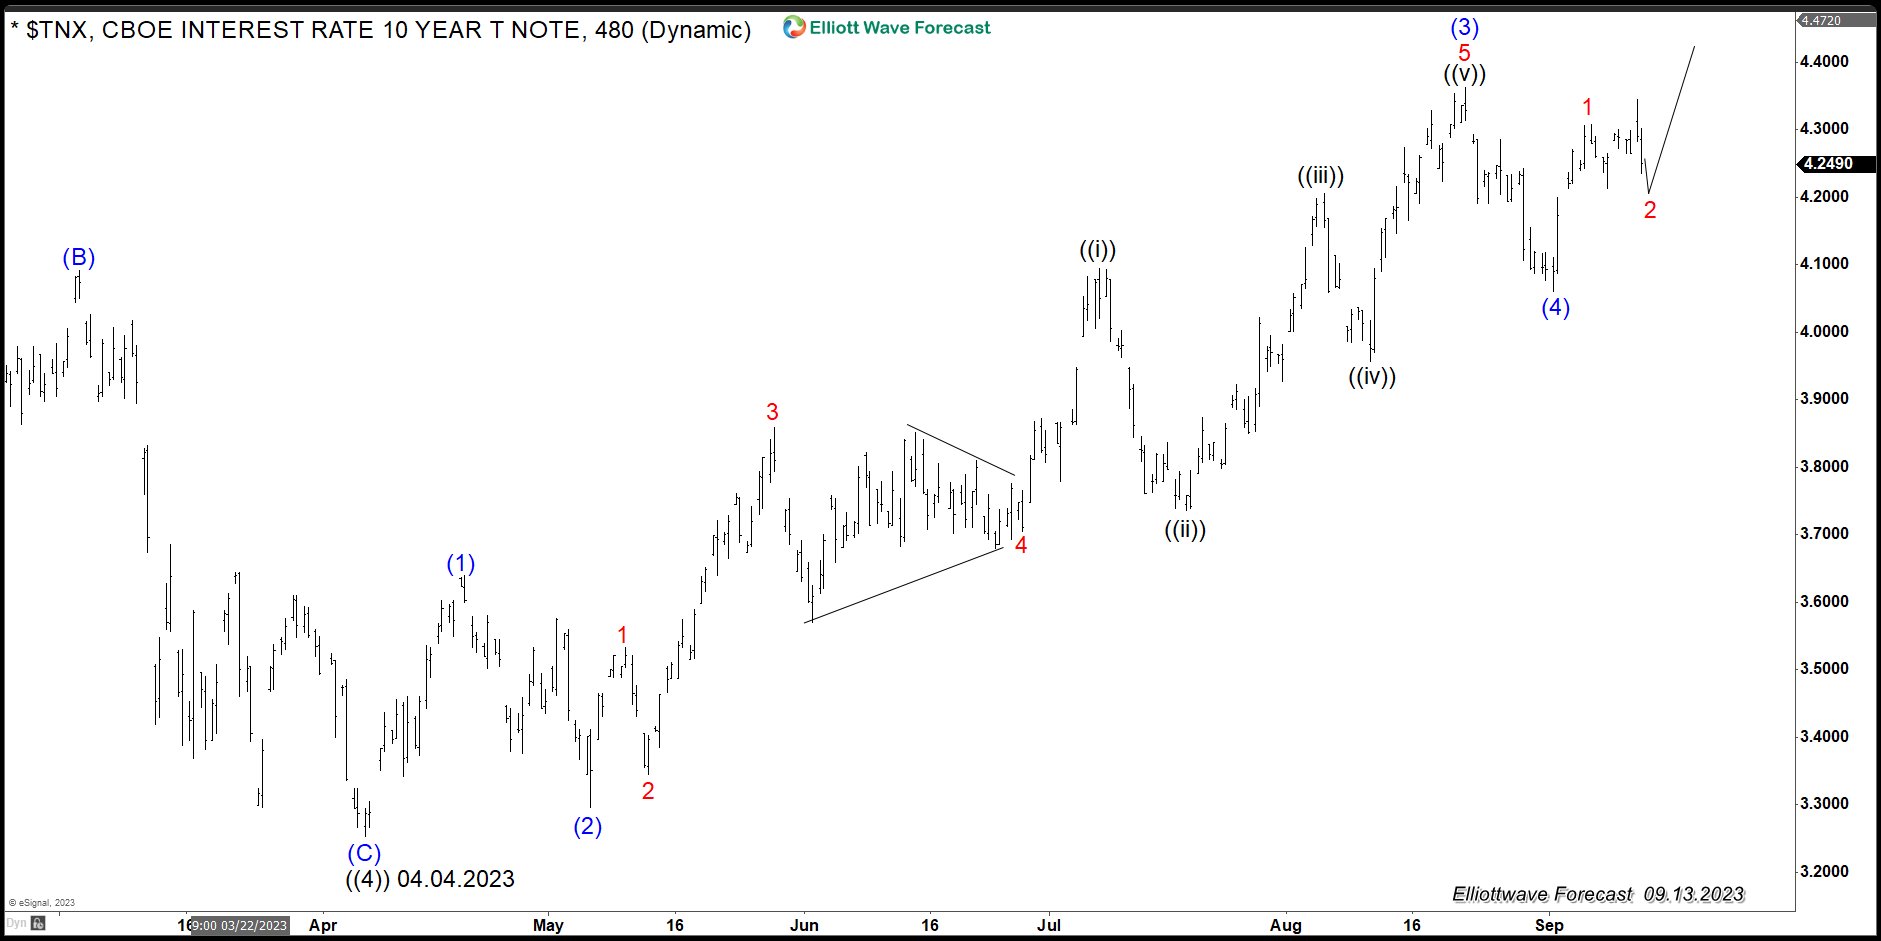
The 4 hour chart above shows $TNX is trading in wave ((5)) within wave I. The structure of the rally is an impulse and one more high can happen, It is however sending a warning that March 2020 is coming to an end soon. The confirmation will come when the low at 04.04.2023 is broken. It is clear at this stage the market is fractal, and each cycle repeats in each degree.
We at EWF pay a lot of attention to the correlations. We correlated the Yields with YEN. Higher Yields mean weaker YEN and lower Yields mean stronger YEN. Let’s look at the following correlation chart:
Correlation Chart between $TNX and $USDJPY
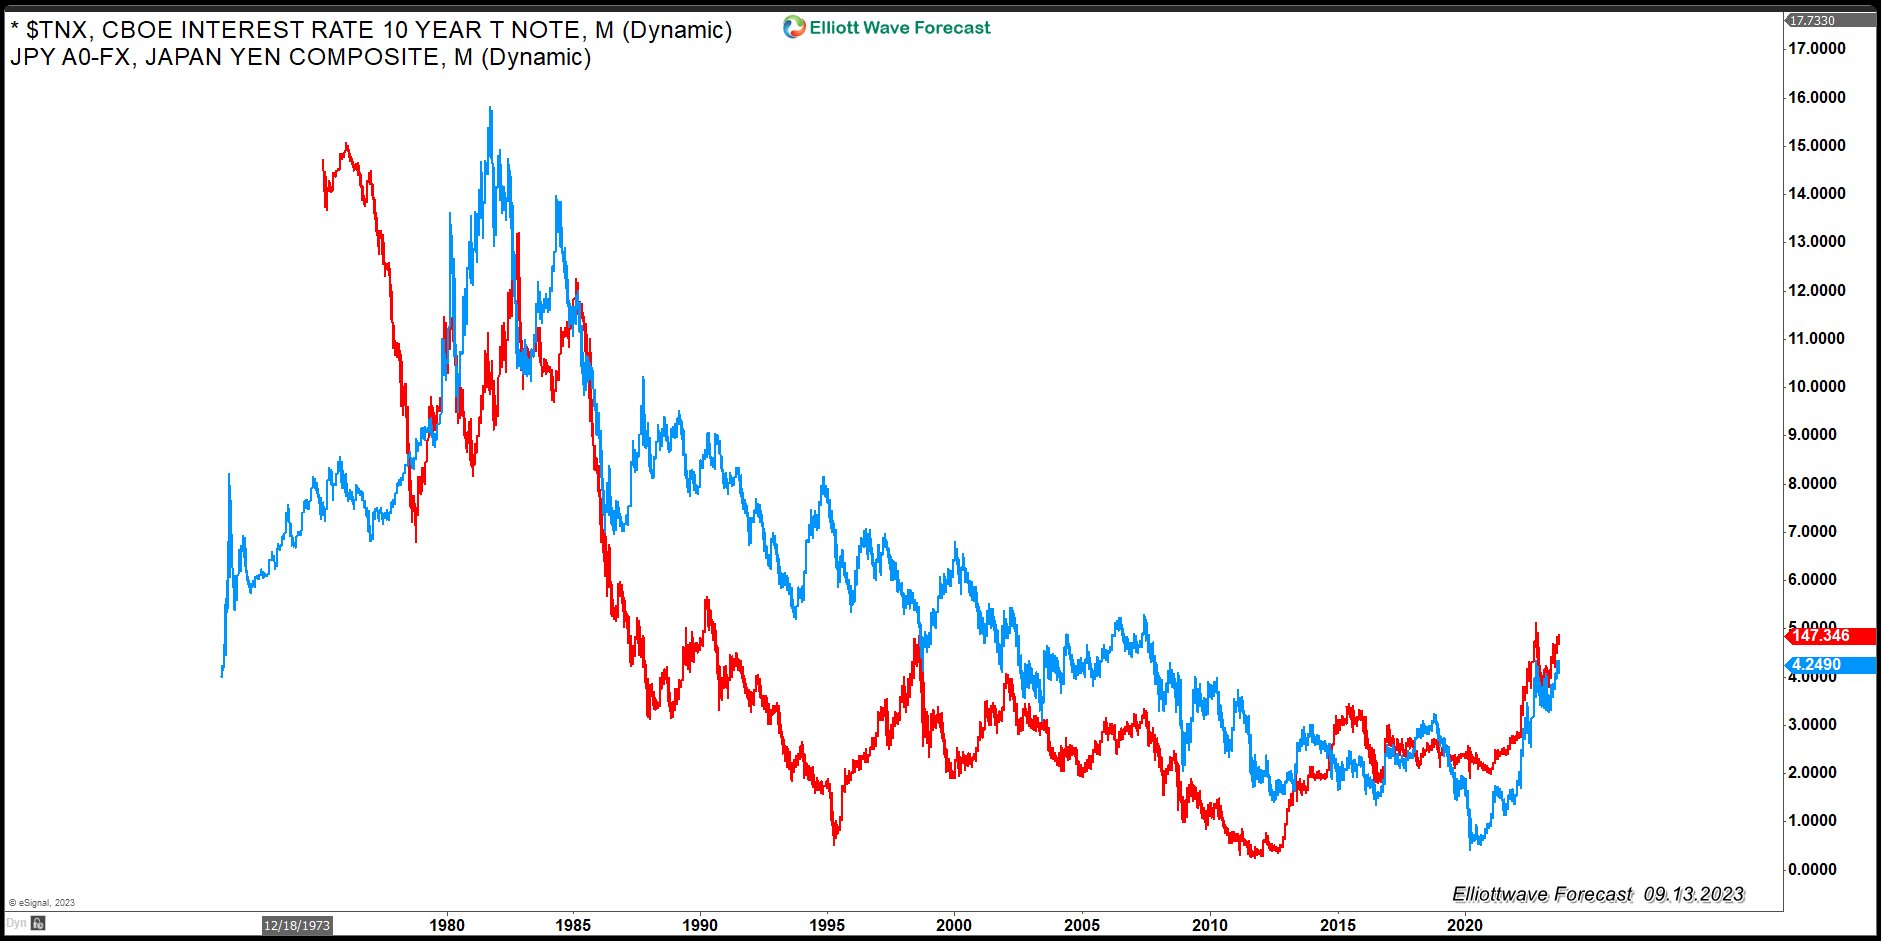
We can see from the chart above how the Yields are very well correlated to the USDJPY. As we can see, they are both positively correlated. Both should be trading higher based on the Yield structure and five waves since the lows on March 2020. As we always do at EWF, we follow the Market dynamics. With the higher Yields and the Yen weakness that follows, it is hard to see a strong YEN selling below the March 2020 lows. This in turns correlates to Indices and also support the Indices against March 2020 lows. As always, we follow the Technical and not the Fundamentals. The price action is calling for a massive advance in the Yields and a lot of YEN weakness to come after the Weekly three waves back.
Source: https://elliottwave-forecast.com/video-blog/tnx-10-year-treasury-bond-yields/