
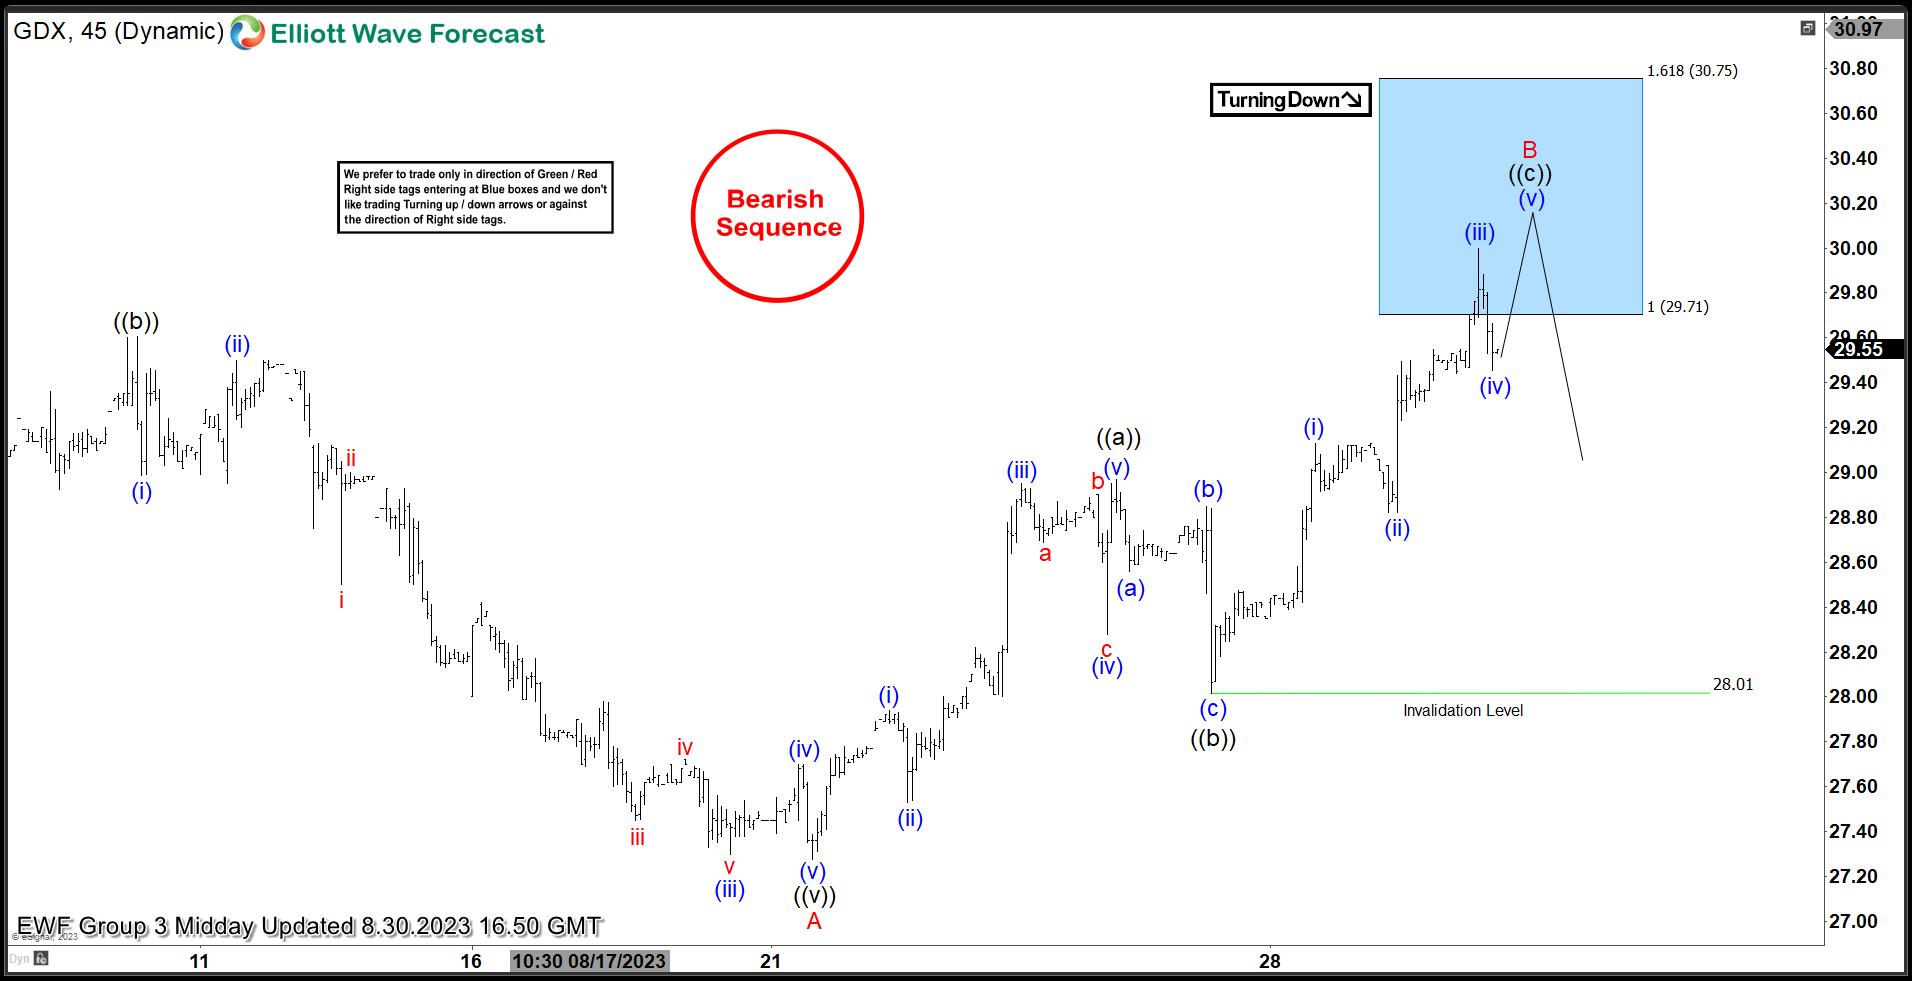
Hello everyone. In today’s article, we will look at the past performance of the 1 Hour Elliott Wave chart of VanEck Gold Miners ETF ($GDX). The pullback from 7.18.2023 high unfolded as a 5 wave impulse with an incomplete bearish sequence from 5.04.2023 high. So, we advised members to sell the bounce in 3 swings at the blue box area ($29.71– 30.75). We will explain the structure & forecast below:
$GDX 1H Elliott Wave Chart 8.30.2023:
Here is the 1H Elliott Wave count from 8.30.2023. The bounce from 8.21.2023 at red A unfolded in a zigzag structure (abc) where sellers were expected to appear at $29.71– 30.75.
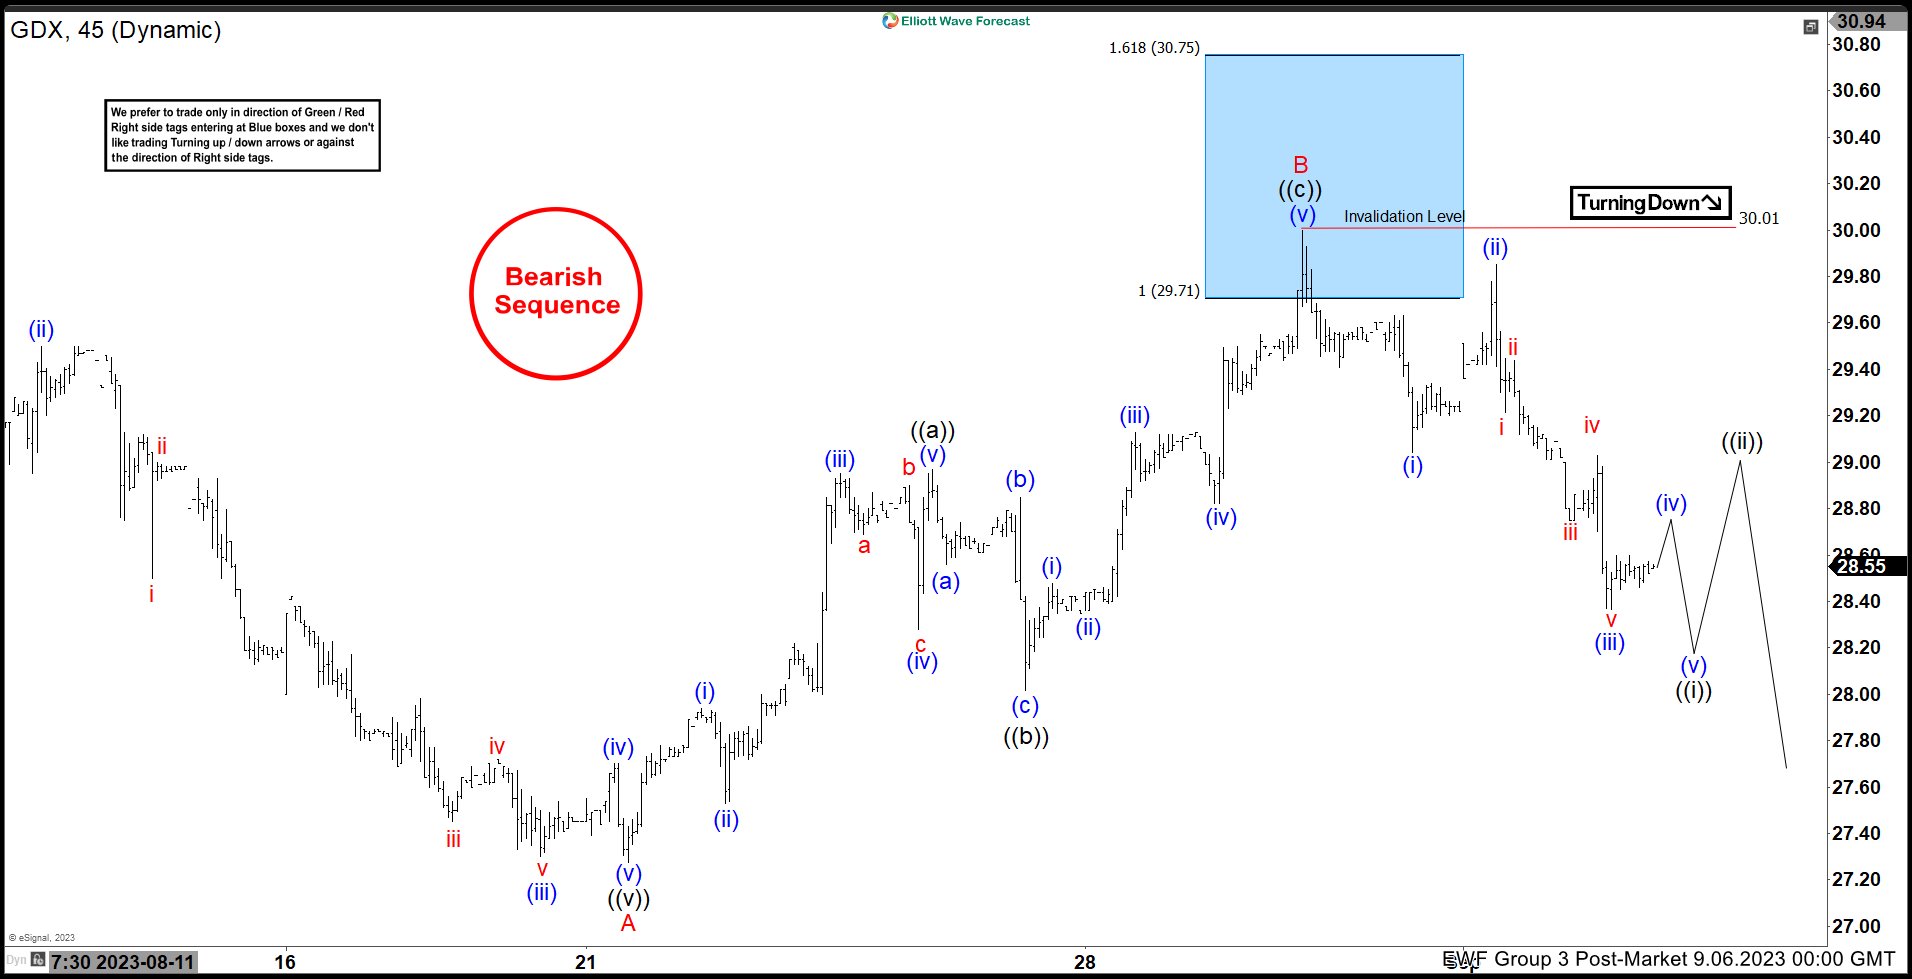
$GDX 1H Elliott Wave Chart 9.06.2023:
Here is the 1H update from 9.06.2023 showing the move taking place as expected. The ETF has reacted lower from the blue box allowing shorts to get a risk free position. Alternatively, the bounce can become 7 swings before lower again. Near term, we like it lower towards 25.44 – 23.67 before a reaction higher can take place.
Source: https://elliottwave-forecast.com/stock-market/vaneck-gold-miners-etf-gdx-reacts-lower-blue-box-area/