
The stock market has been sideways since the peak in 2022. The U.S real estate market, as measured by DJUSRE Index has also been sideways to lower. We have been providing the path for the U.S. real estate market for years and finally it reached our target at the $453.00 area. The Federal Reserve has increased the interest rate very fast over the last year from 0.25% to 5.50%, making the housing market go sideways to lower. At EWF, we look at the price action more than any fundamental news or event.
In this case, both fundamental and technical agree to a certain degree. The narrative states that lower rate motivates buyers to buy, while higher rate has the opposite impact. At this stage, the decline in the DJUSRE has been relatively small compared to the velocity of the rate hikes. Read our previous article showing the path higher into the $453.00 area and the expected pullback from Blue Box area. Now that we have reached the target, the big question is what is coming next.
First, we must understand The Grand Super Cycle, which shows a five-wave advance since the lows, as shown in the following chart.
$DJUSRE Monthly Elliott Wave Chart
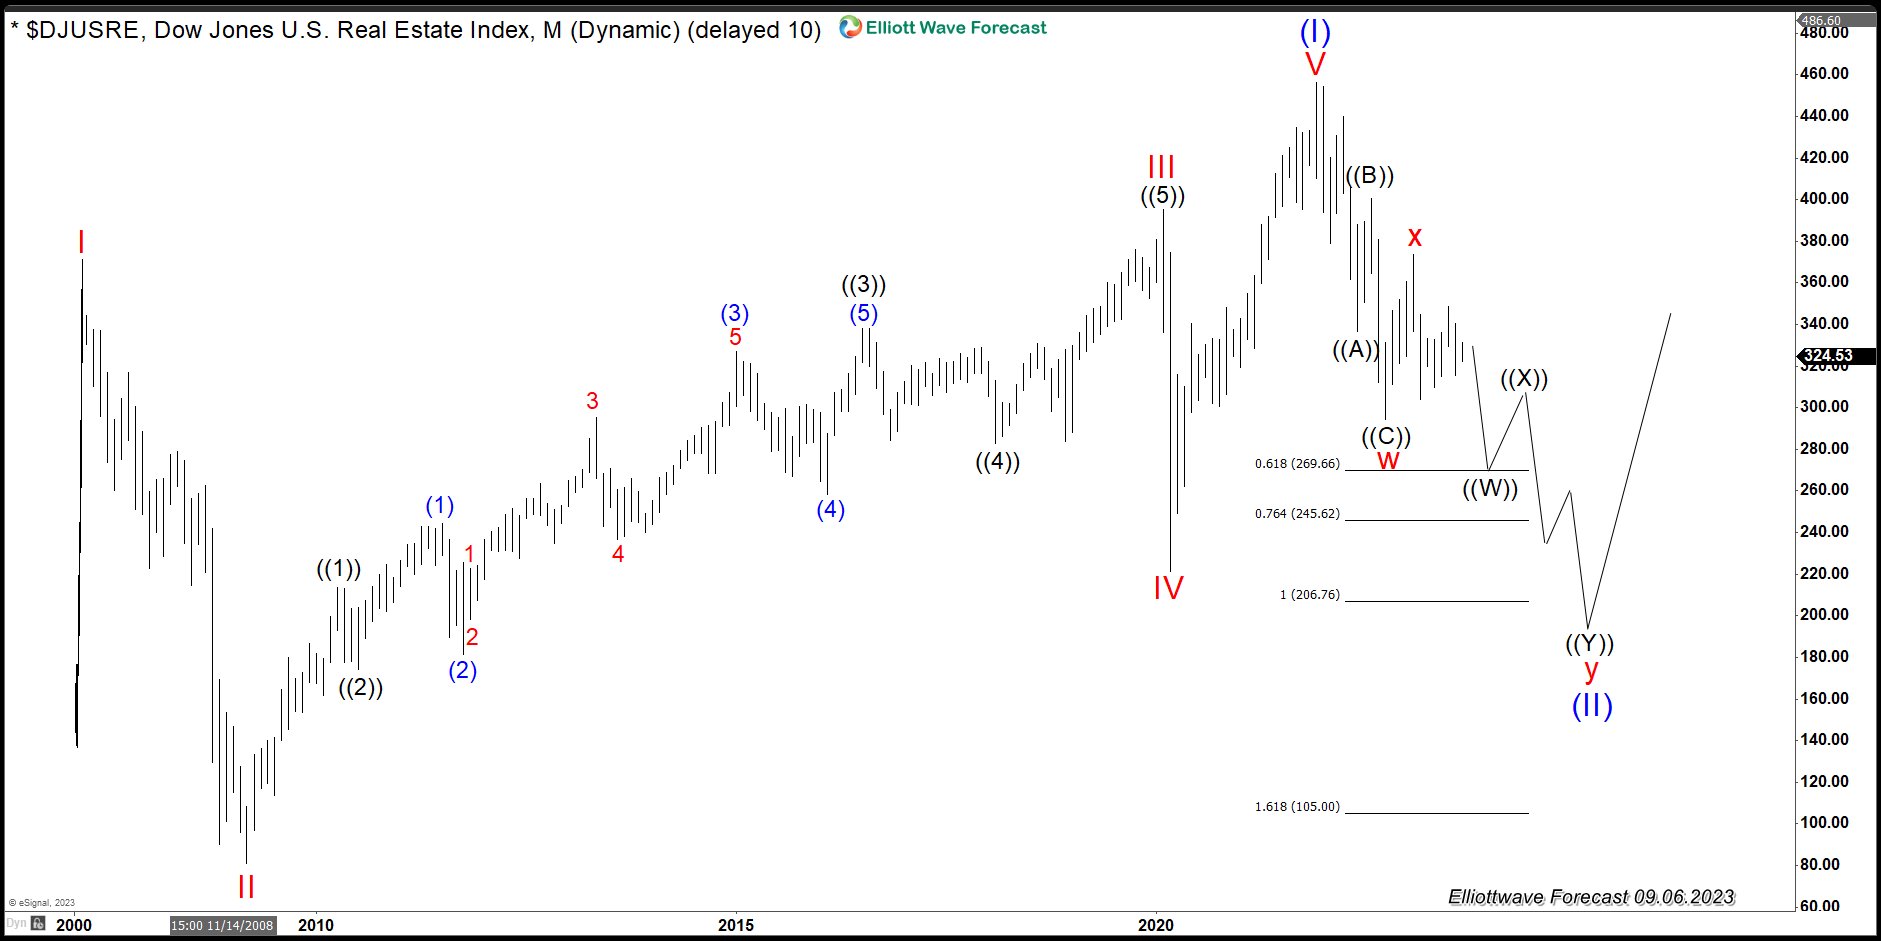
The monthly above shows wave (I) ended on October 2021. The Index is now doing a wave (II) pullback with WXY structure internal subdivision. It’s currently in wave Y which can last into 2024. The five waves advance gives the buyers complete control within the Grand Super Cycle. But first, we need to finish the correction in wave (II).
$DJUSRE Daily Elliott Wave Chart
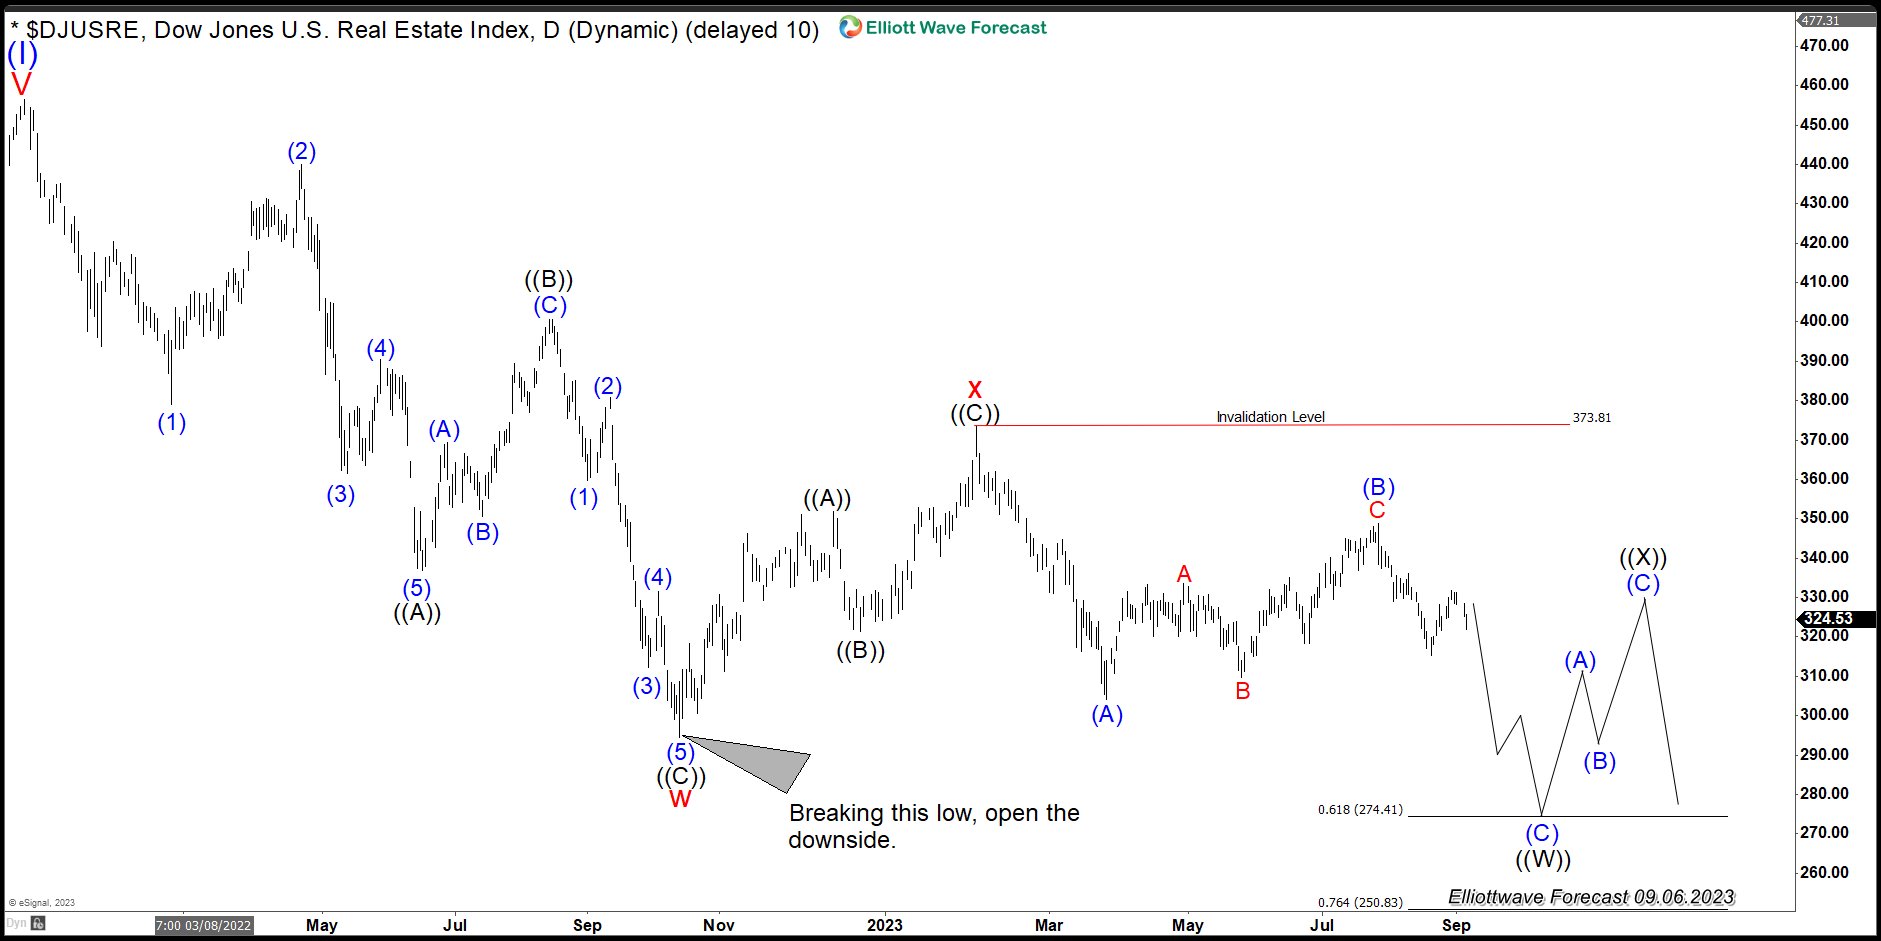
The Daily Chart above shows the corrective structure since the peak on 11.2021. As we can see, the first leg of the pullback (wave W) is a three waves pullback. It is a 5-3-5 structure which is enough for the entire correction to end. The buyers entered the market back on 10.12.2022 at the same time when most of the Indices created a bounce. However, the reaction higher wave X also unfolded in three waves and then made another impulse lower wave (A). Wave A direction agrees with the direction of the previous decline since the peak at 11.2021. Then, the Index did another corrective rally wave (B) which also ended in three waves. At this point, we believe the sellers are in control, and confirmation will come when the low at 10.2022 is broken. This should open the downside into the $211.00 target area, representing a unique buying opportunity for buyers to enter the market.
The whole Market is at risk of a pullback, and the Real Estate Market should be entering a challenging period. It should also provide the floor for another buying opportunity sometime in 2024. The way interest rates are now is not helping the real estate market. Even when it will not be another 2007 crash, there will be another opportunity for cash buyers or mortgage-related buyers. It is better to wait if the 10.2022 level breaks. Let’s see how it plays out, but the warning is there.
Source: https://elliottwave-forecast.com/video-blog/djusre-u-s-real-estate-index-a-sell-off-can-happen/