
In this technical blog, we will look at the past performance of the 1-hour Elliott Wave Charts of CHFJPY. In which, the rally from 13 January 2023 low unfolded as an impulse sequence and showed a higher high sequence. Therefore, we knew that the structure in CHFJPY is incomplete to the upside & should see another leg higher to complete the impulse rally. So, we advised members not to sell the pair & buy the dips in 3, 7, or 11 swings at the blue box areas. We will explain the structure & forecast below:
CHFJPY 1-Hour Elliott Wave Chart From 7.12.2023
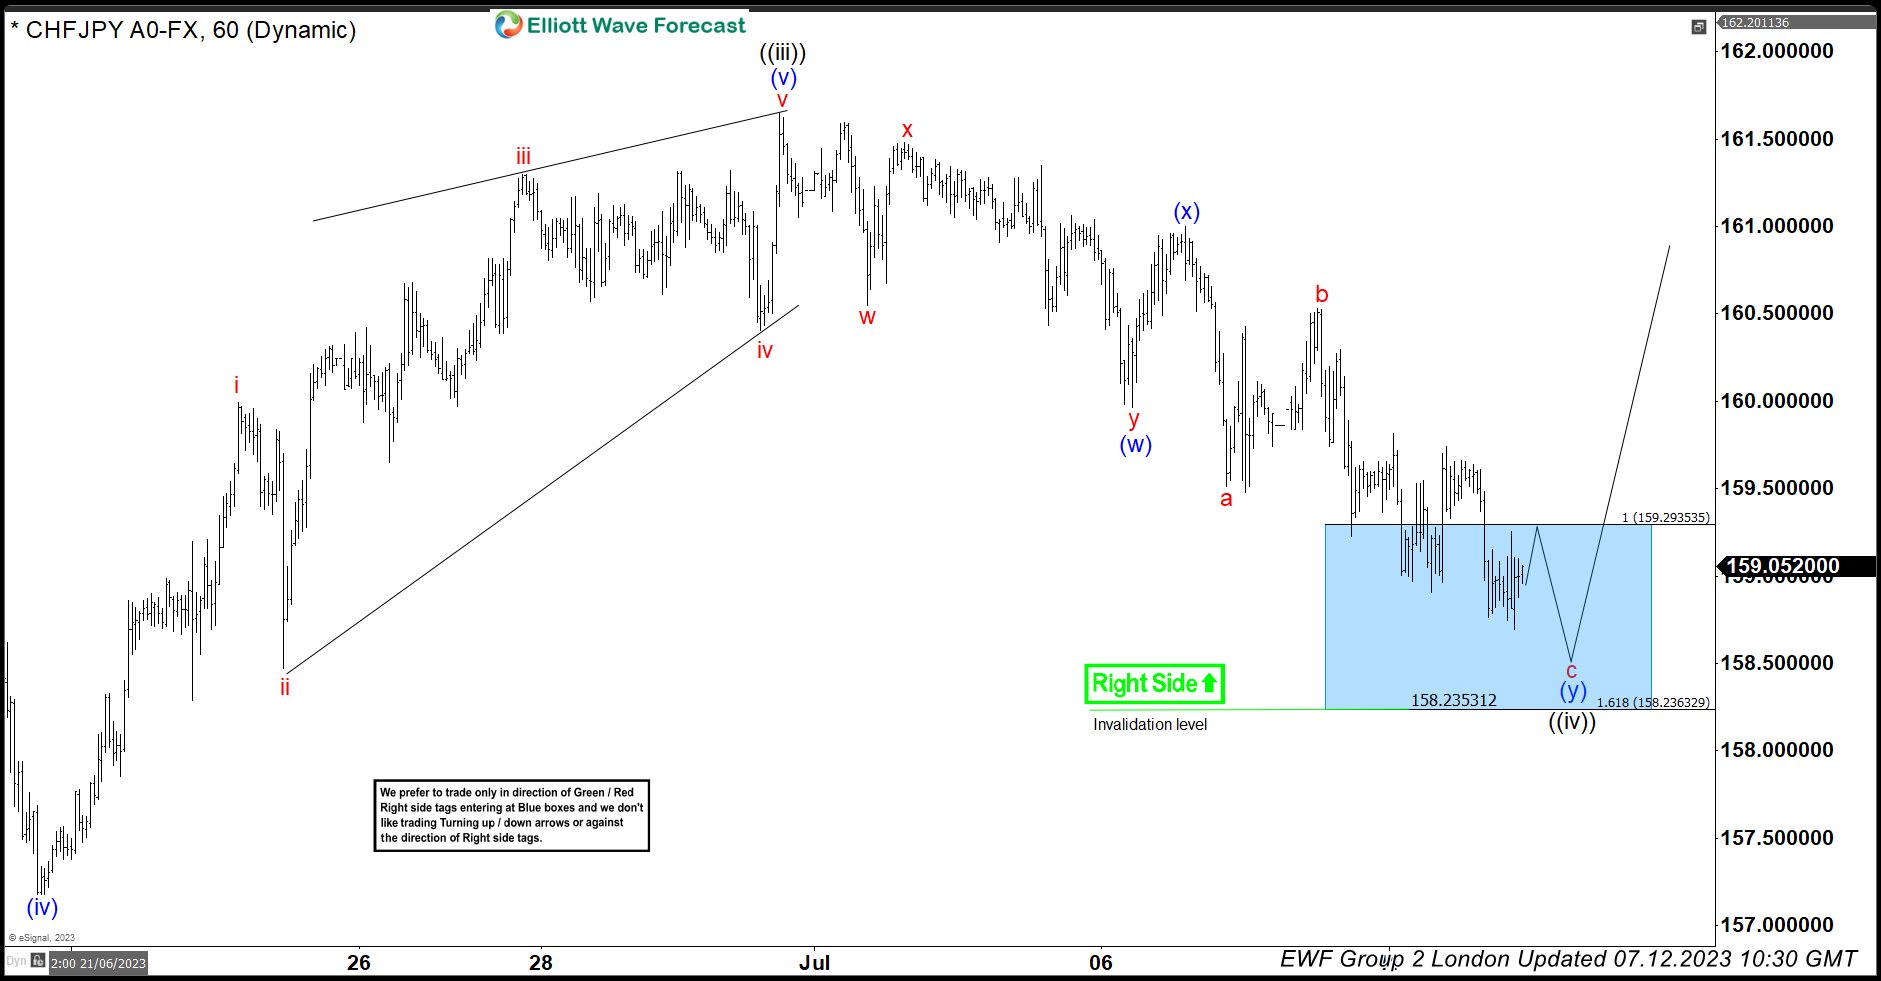
Here’s the 1hr Elliott wave Chart from the 7/12/2023 update. In which, the rally to 161.64 high ended wave ((iii)) & made a pullback in wave ((iv)). The internals of that pullback unfolded as Elliott wave double three correction where wave (w) ended in 3 swings at 159.96 low. Then a bounce to 160.99 high ended wave (x) & started the next leg lower in wave (y) towards 159.29- 158.23 blue box area. From there, buyers were expected to appear looking for new highs ideally or for a 3 wave bounce minimum.
CHFJPY Latest 1-Hour Elliott Wave Chart from 7.25.2023
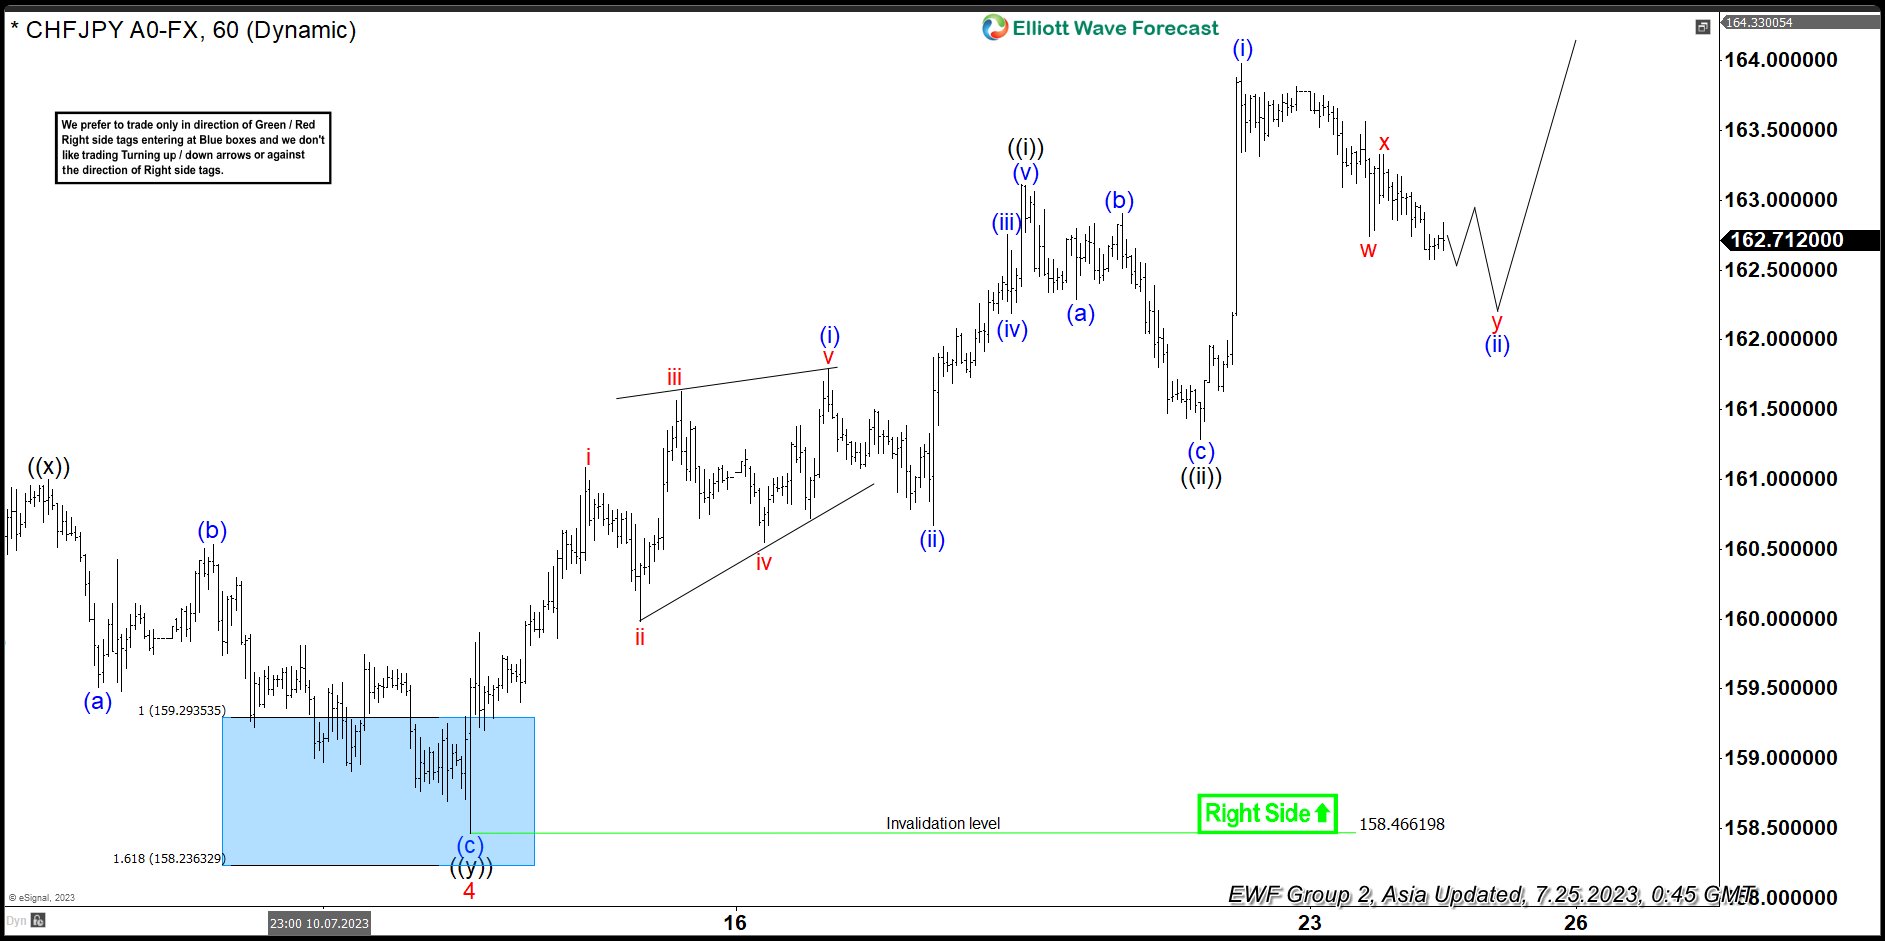
This is the latest 1hr Elliott wave Chart from the 7/25/2022 Asia update. In which the pair is showing a strong reaction higher taking place, right after ending the double correction within the blue box area. Allowed members to create a risk-free position shortly after taking the long position at the blue box area. Since then the pair has already made new highs supporting some more upside. Note, with further data, we were able to adjust the degree into wave 5 higher.
Source: https://elliottwave-forecast.com/forex/chfjpy-strong-rally-elliott-wave-blue-box/