Pfizer, Inc. is an US American pharmaceutical and biotechnology company. Founded in 1849 and headquartered in New York, USA, it is a part of S&P100 and S&P500 indices. Investors can trade it under the ticker $PFE at New York Stock Exchange. Pfizer develops and produces medicines and vaccines for immunology, oncology, cardiology, endocrinology, and neurology. The company’s largest products by sales are the Pfizer–BioNTech COVID-19 vaccine ($37 billion in 2022 revenues), Nirmatrelvir/Ritonavir ($18 billion in 2022 revenues), Apixaban ($6 billion in 2022 revenues), a pneumococcal conjugate vaccine ($6 billion in 2022 revenues), and Palbociclib ($5 billion in 2022 revenues). In 2022, 42% of the company’s revenues came from the United States, 8% came from Japan, and 50% came from other countries.
Even though Pfizer made important revenues in 2022, the stock price was in a steady decline during the entire 2022. Even more, until now, it has not found a bottom yet. In this article, we explain that $PFE is trading within weekly bearish sequence. Soon it should reach next support area. We talk about $PFE wave structure, buying opportunities and about medium- to long-term price target areas.
Pfizer Monthly Elliott Wave Analysis 07.23.2023
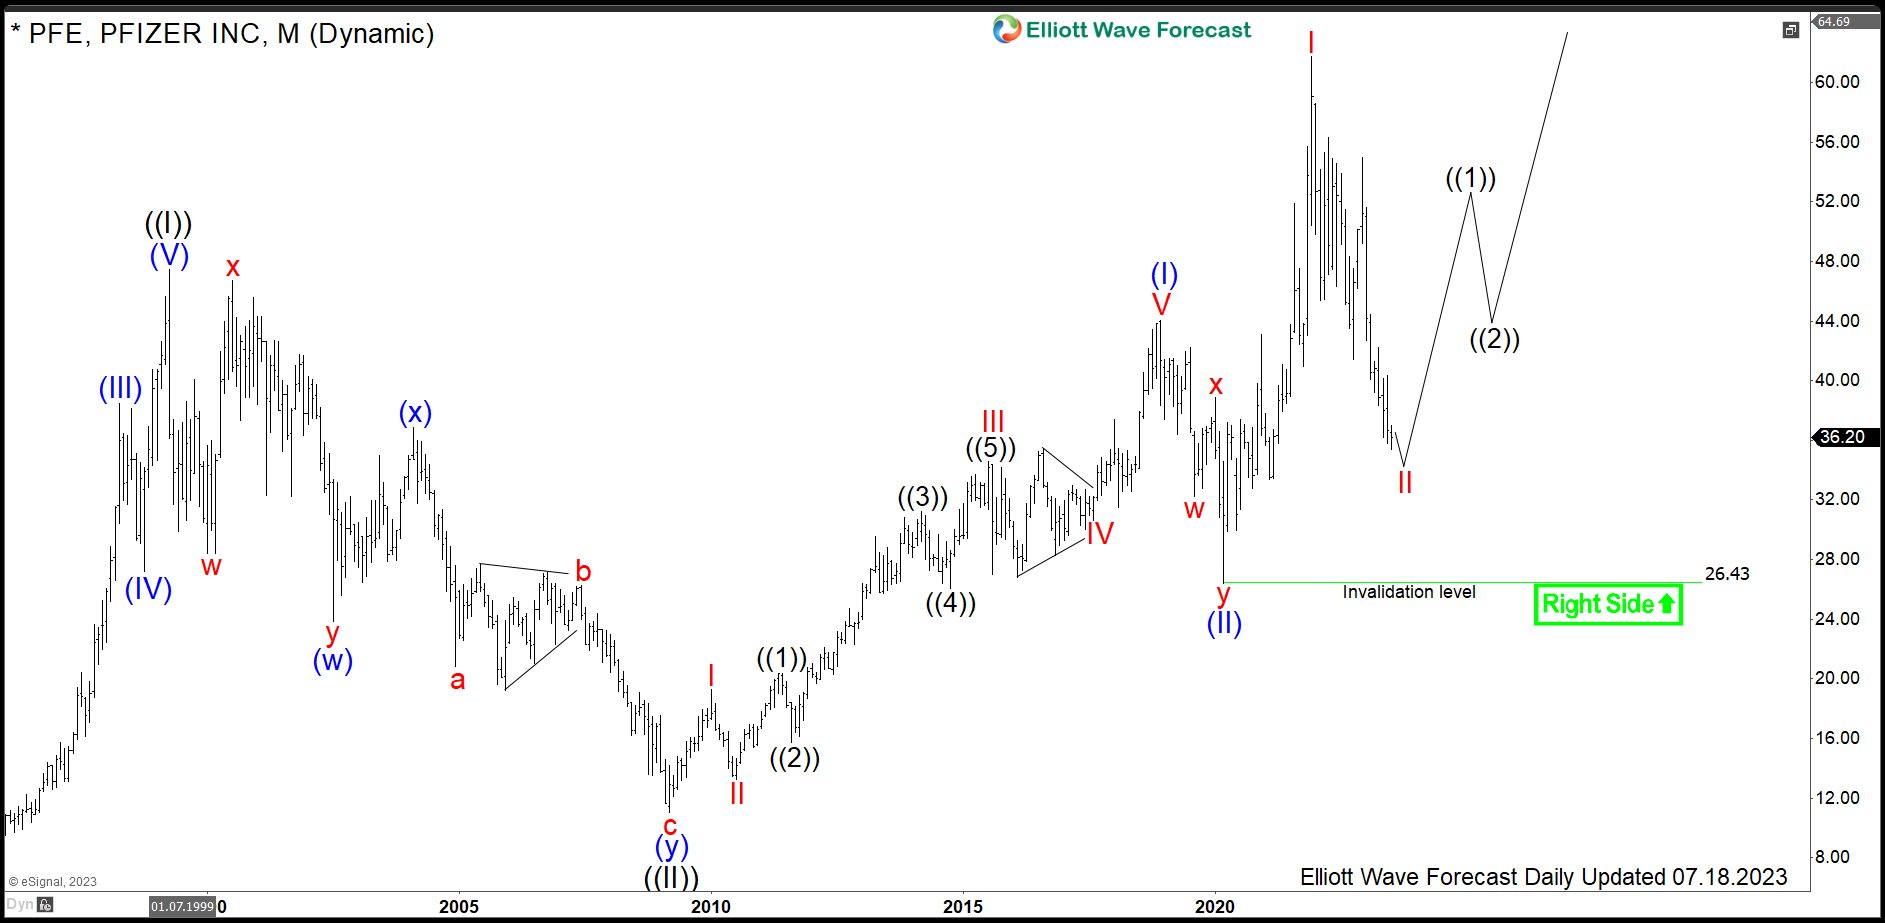
The monthly chart below shows the Pfizer stock $PFE traded at NYSE. From the all-time lows, the stock price is showing a nesting price action. Firstly, initial impulse in black wave ((I)) of grand super cycle degree has ended in April 1999 at 47.44 highs. From there, a consolidation lower in black wave ((II)) as a double three pattern has set an important bottom in March 2009 at 11.02 lows. Secondly, from the March 2009 lows, new cycle in blue wave (I) of super cycle degree has started. It has printed a high in December 2018 at 44.05 highs. From there, a pullback in blue wave (II) has unfolded as another double three pattern. It has bottomed in March 2020 at 26.43 lows.
Thirdly, from the lows of March 2020, a new cycle in blue wave (III) of black wave ((III)) has started. It has been confirmed by breaking both December 2018 and April 1999 highs. The target for blue wave (III) is 59.48-79.92 area and even beyond. In fact, the price action has already reached the minimum target being 59.48. However, it is the preffered view that the advance from March 2020 lows was nothing more than red wave I of blue wave ((III)). Also, current pullback remains above 26.43 lows and looks corrective. The consolidation is, therefore, likely to be a red wave II. Once ended, expect acceleration higher within red wave III of blue wave (III).
Pfizer Weekly Elliott Wave Analysis 07.23.2023
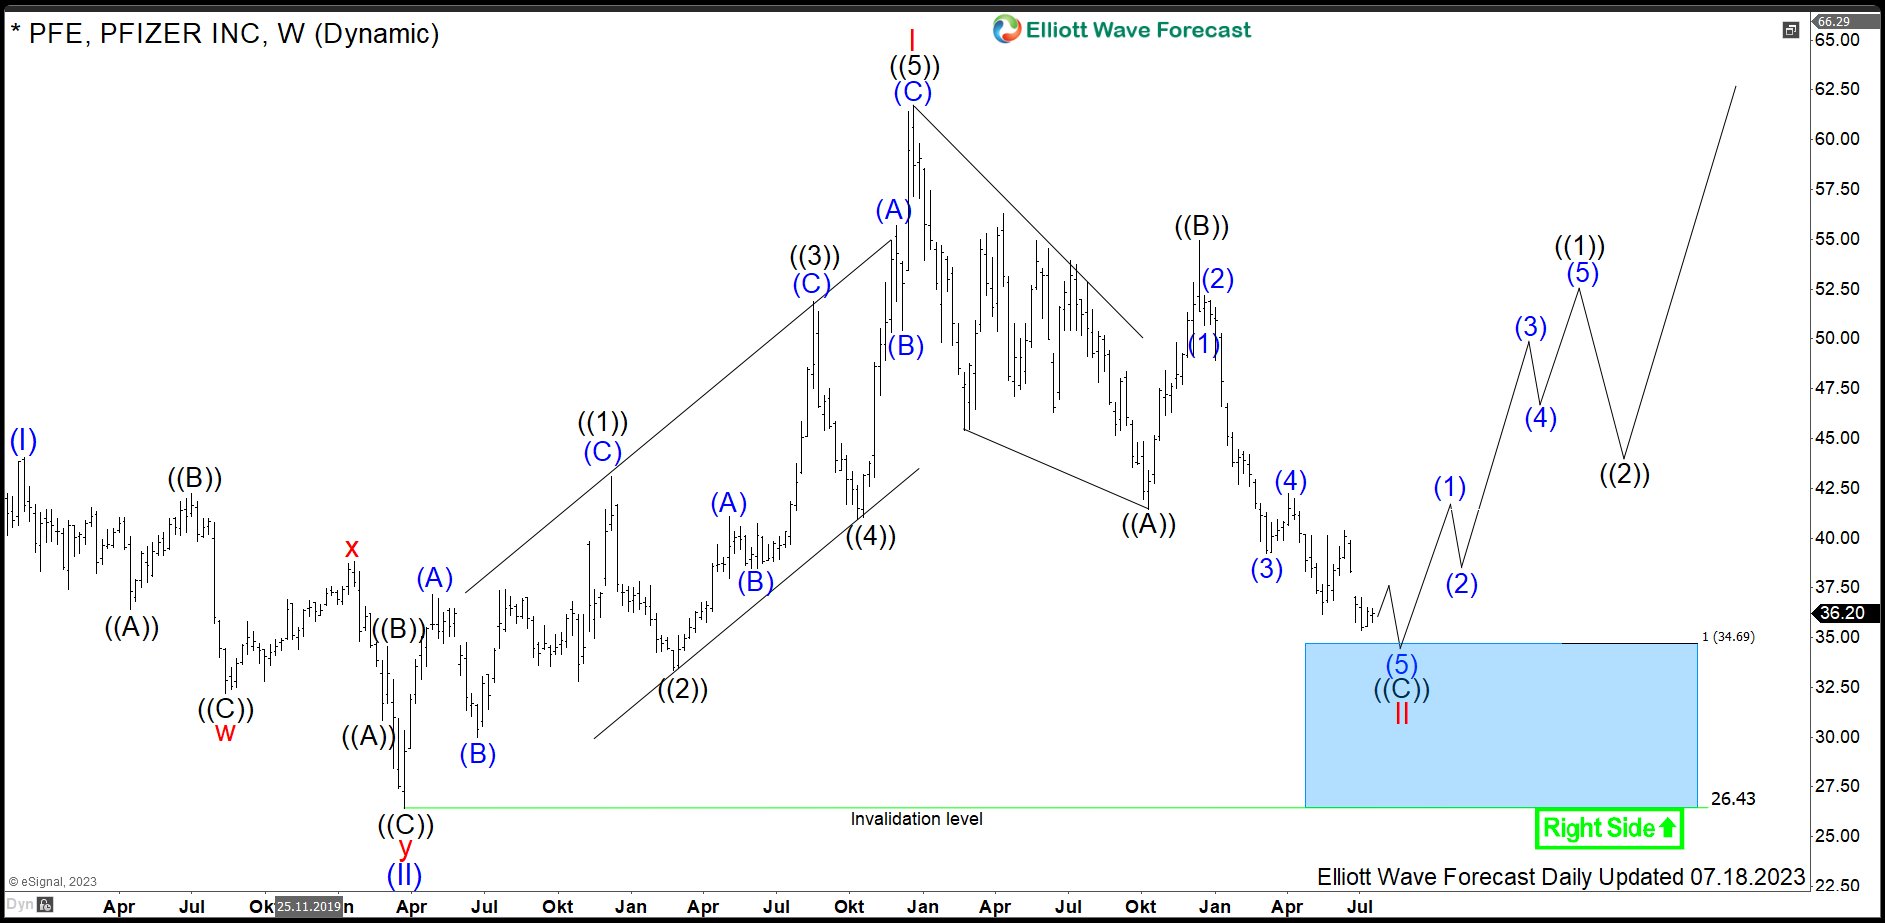
The weekly chart below shows first stages of the blue wave (III). Hereby, we can see a nest comprising of red waves I and II in formation. The initial advance in red wave I is an Elliott wave leading diagonal pattern being 3-3-3-3-3 structure. Importantly, the $PFE price has broken towards the new all-time highs. As a matter of fact, it has confirmed next extension higher. Hereby, red wave I has printed its top at 61.71 on December 2021. From there, pullback in red wave II is unfolding as a zigzag pattern being 5-3-5 structure.
Firsty, leading diagonal in black wave ((A)) of red wave II has printed a low at $41.45 in October 2022. Then, a bounce has set a connector wave ((B)) at $54.93 highs in December 2022. Later on, the price has broken 41.45 lows opening up a bearish sequence. As a consequence, target area for black wave ((C)) is towards 34.69-26.43 area. As of today, impulse in black wave ((C)) has enough number of swings to be counted completed. However, target area has not been reached yet. Investors and traders can be looking to buy $PFE from 34.69-26.43 area targeting 61.71 highs and even higher.
Source: https://elliottwave-forecast.com/video-blog/buying-weekly-dips-pfizer/