
Deutsche Telekom AG is a German telecommunications company and by revenue the largest telecommunications provider in Europe. Formed in 1995 and headquartered in Bonn, Germany, the company operates several subsidiaries worldwide. Deutsche Telekom is a part of both DAX40 and of SX5E indices. Even though the stock is highly appreciated by investors, the stock price has seen better times. As a matter of fact, it has not recovered after a strong decline from the all-time highs in 2000 at 104.90.
A closer look on the price action of the stock provides insights on the further development. Indeed, from 2012 lows one can observe a long base forming. In the initial article from November 2020, we have forecasted a breakout above the May 2017 highs at 18.15 to happen. Indeed, from 14.84 in November 2020, the stock has reached 18.92 in August 2021. Hereby, it has opened a bullish sequence. Then, in the second article from March 2022, we were expecting to see buyers entering at 14.26-12.07 area. The pullback truncated in the 3rd swing and next bullish cycle took place. Here, we discuss the overall bullish structure in the stock of Deutsche Telekom, providing next buying ideas and target areas.
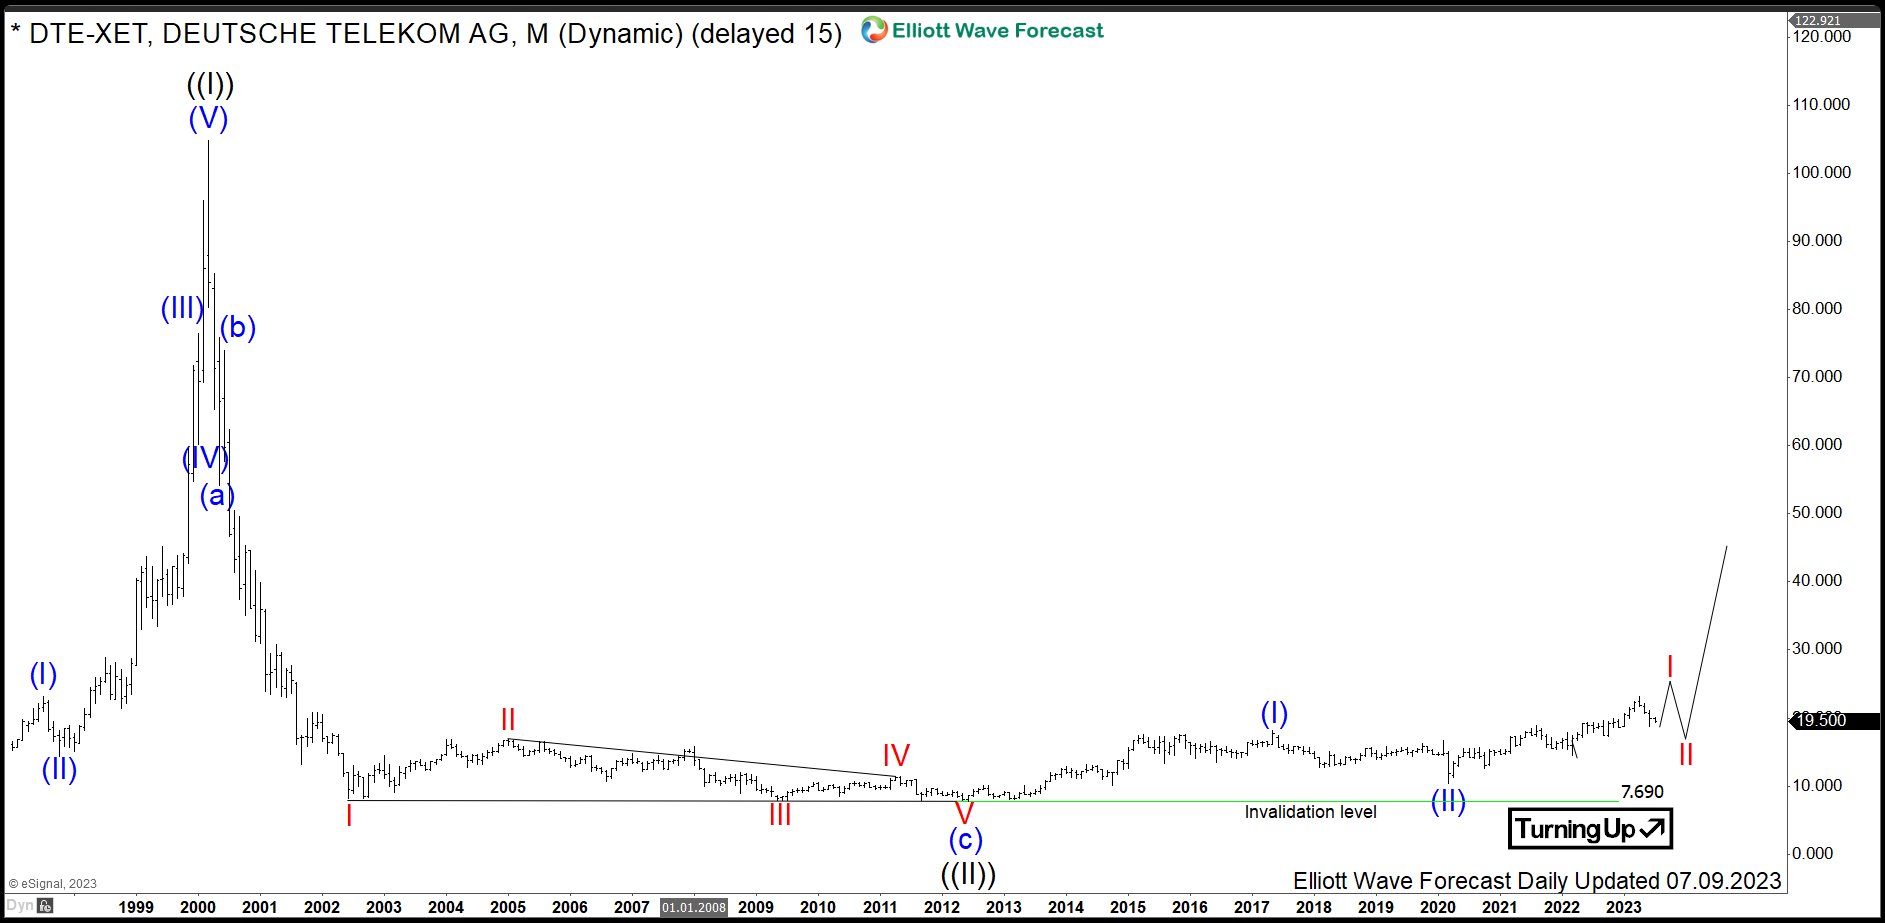
Deutsche Telekom Monthly Elliott Wave Analysis 07.09.2023
The monthly chart below shows the Deutsche Telekom stock $DTE traded at XETRA. From the all-time lows, the stock price has developed a cycle higher in black wave ((I)) of grand super cycle degree towards the all-time highs on March 2000 at 104.90. From the highs, a correction lower in black wave ((II)) has unfolded as an Elliott wave zigzag pattern. It has printed an important bottom on June 2012 at 7.69.
From June 2012 lows, a new cycle in wave ((III)) has already started and should extend towards 104.90 highs and even higher. Within wave ((III)), first nest comprising blue waves (I)-(II) has ended in March 2020 at 10.40 lows. From there, second nest in red waves I-II is currently in progress. Once finished, expect acceleration higher in red wave III of blue wave (III).
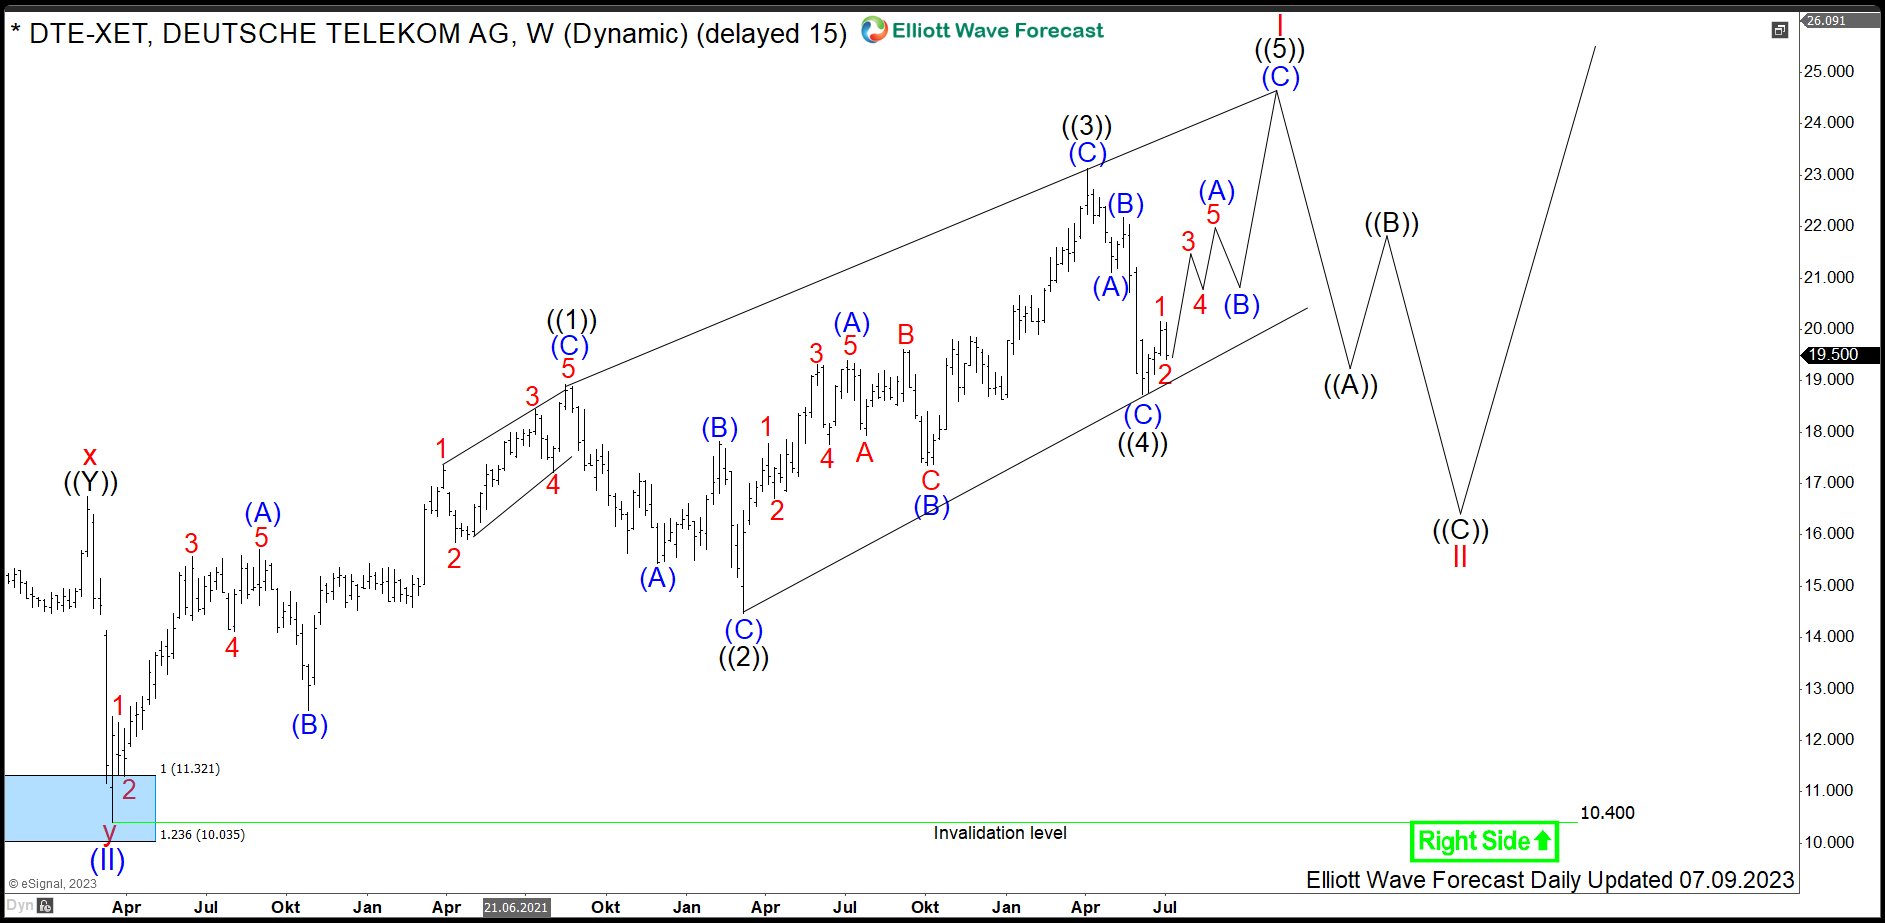
Deutsche Telekom Weekly Elliott Wave Analysis 07.09.2023
The weekly chart below shows in more detail the second nest comprising red waves I-II in formation. From March 2020 lows 10.40, $DTE price action has a structure of 3-3-3-3-3 Elliott wave leading diagonal. Firstly, 3 waves in black wave ((1)) have set a top at 18.92 in August 2021. Secondly, pullback in 3 swings has found a bottom at 14.46 lows in March 2022. Thirdly, another 3 swings in black wave ((3)) have provided with a new high at 23.12 in April 2023. Then, correction in black wave ((4)) has ended at 18.72 lows in June 2023. Hereby, waves ((1)) and ((4)) are overlapping which is a typical feature of diagonal structures. Now, while $DTE stays above 18.72 lows, wave ((5)) is in progress and can reach 24.14-25.82 area. After 5 waves from March 2020, expect red wave I to end and consolidation in red wave II to take place. Investors and traders can join the rally in $DTE while buying red wave II in 3, 7, 11 swings against 10.40 lows.
In the long run, investors can anticipate Deutsche Telekom to break to new all-time highs above 104.90.
Source: https://elliottwave-forecast.com/stock-market/deutsche-telekom-remains-supported/