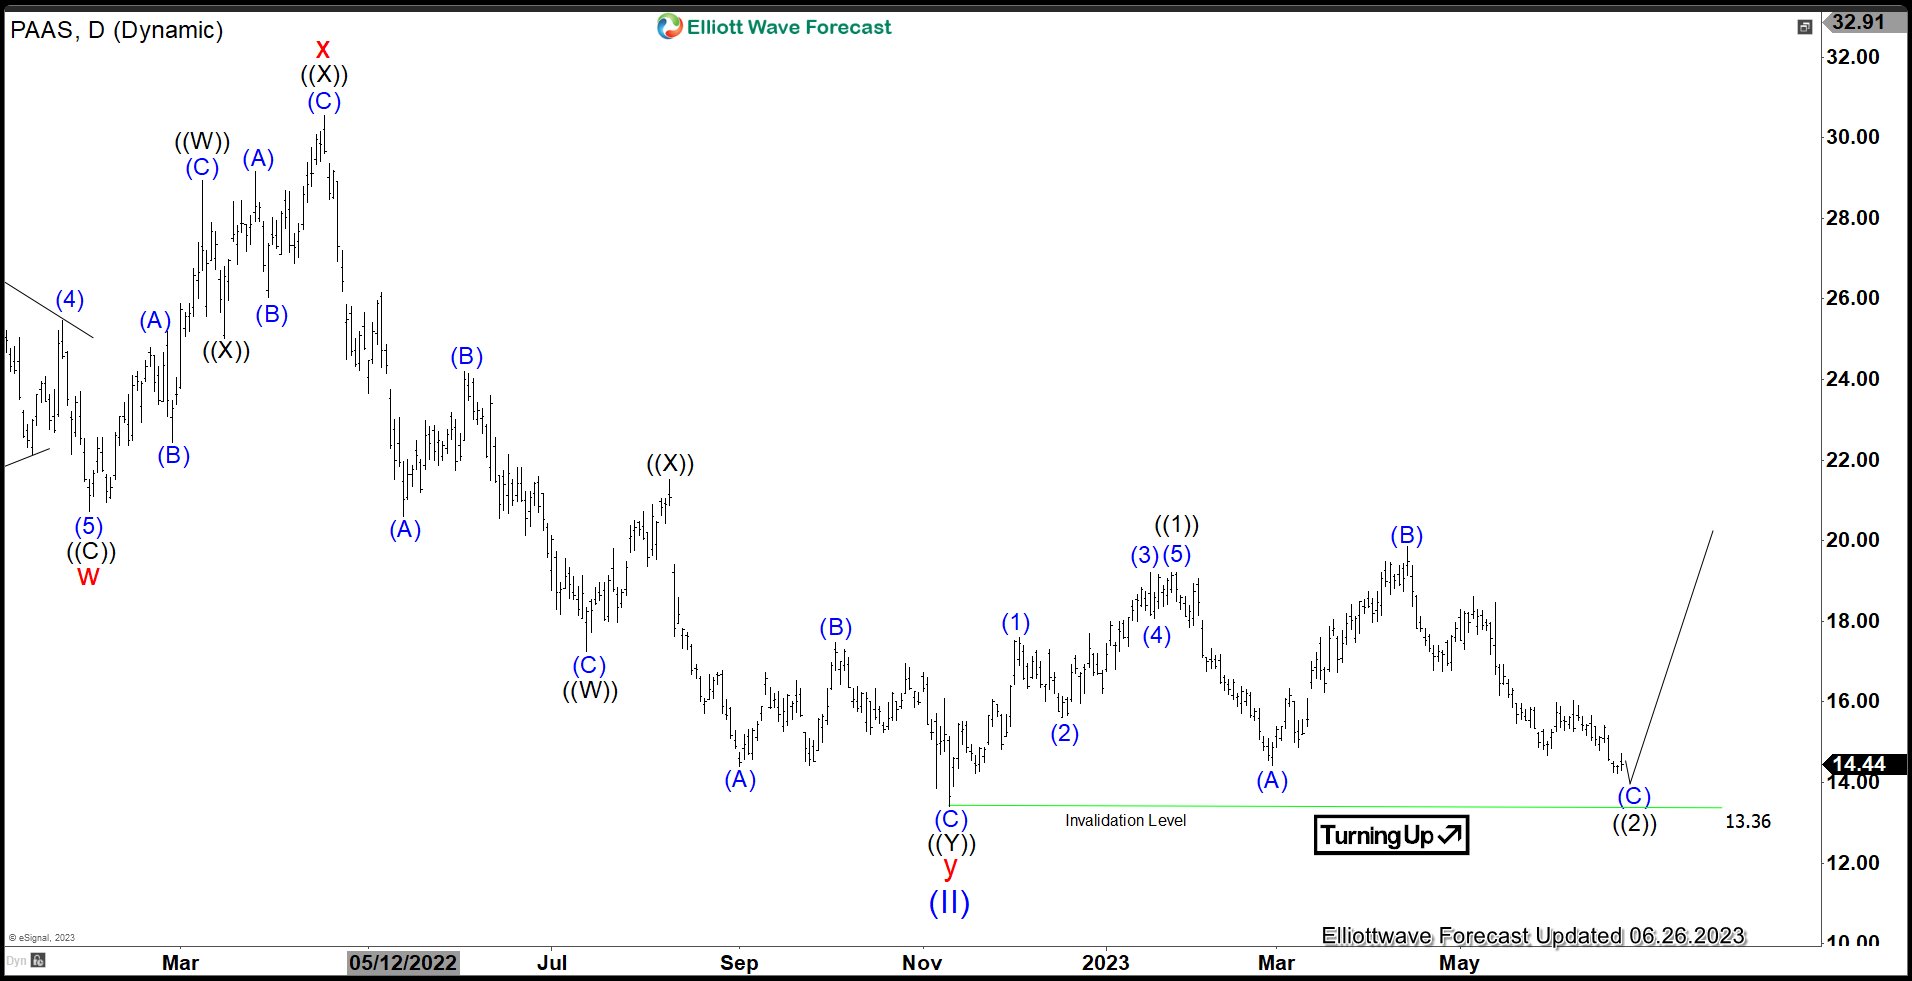
Pan American Silver (PAAS) continues to extend lower and it looks like the stock is correcting in a flat structure as the second daily chart below shows. The stock is a good representation for the silver mining sector. Although it has been pretty tough lately for mining sector generally (both gold and silver miners), a turn higher might be due soon.
PAAS Monthly Elliott Wave Chart
Monthly chart of PAAS above shows the stock made important major low in 2016 at 5.32. Since then, it has rallied higher in 5 waves and ended wave (I) at 40.11. Pullback in wave (II) ended at 13.40 with internal subdivision as a double three. Down from wave (I), wave w ended at 20.73, rally in wave x ended at 30.56, and wave y lower ended at 13.40 which completed wave (II). At this stage, it’s possible that the stock is correcting this rally from 13.40 low as the daily chart below shows as an expanded flat, and while the pivot at 13.4 low holds, it can rally higher again.
PAAS Daily Elliott Wave Chart

Daily Chart of Pan America Silver (PAAS) above suggests a truncated higher high (bullish sequence) from wave (II) at 13.4 low. The first leg of the rally ended wave ((1)) as 5 waves at 19.22. It then pullback and made a marginal high above 19.22 with a divergence. Afterwards, the stock turns lower in what looks to be a 5 waves down. Due to the structure of the rally from 13.4 low (i.e. a higher high with divergence), there’s a possibility that the current pullback is an expanded flat and while it stays above 13.36, then it can rally again.
Source: https://elliottwave-forecast.com/stock-market/pan-american-silver-paas-correcting-flat-structure/

