Hello traders. In this technical article we’re going to take a look at the Elliott Wave charts charts of GBPCAD published in members area of the website. Recently the pair made short term recovery against the 1.6931 peak that has reached the extreme zone. It made clear 3 waves up from the lows and made decline from our Blue Box ( selling zone) . In further text we’re going to explain the Elliott Wave pattern and trading setup
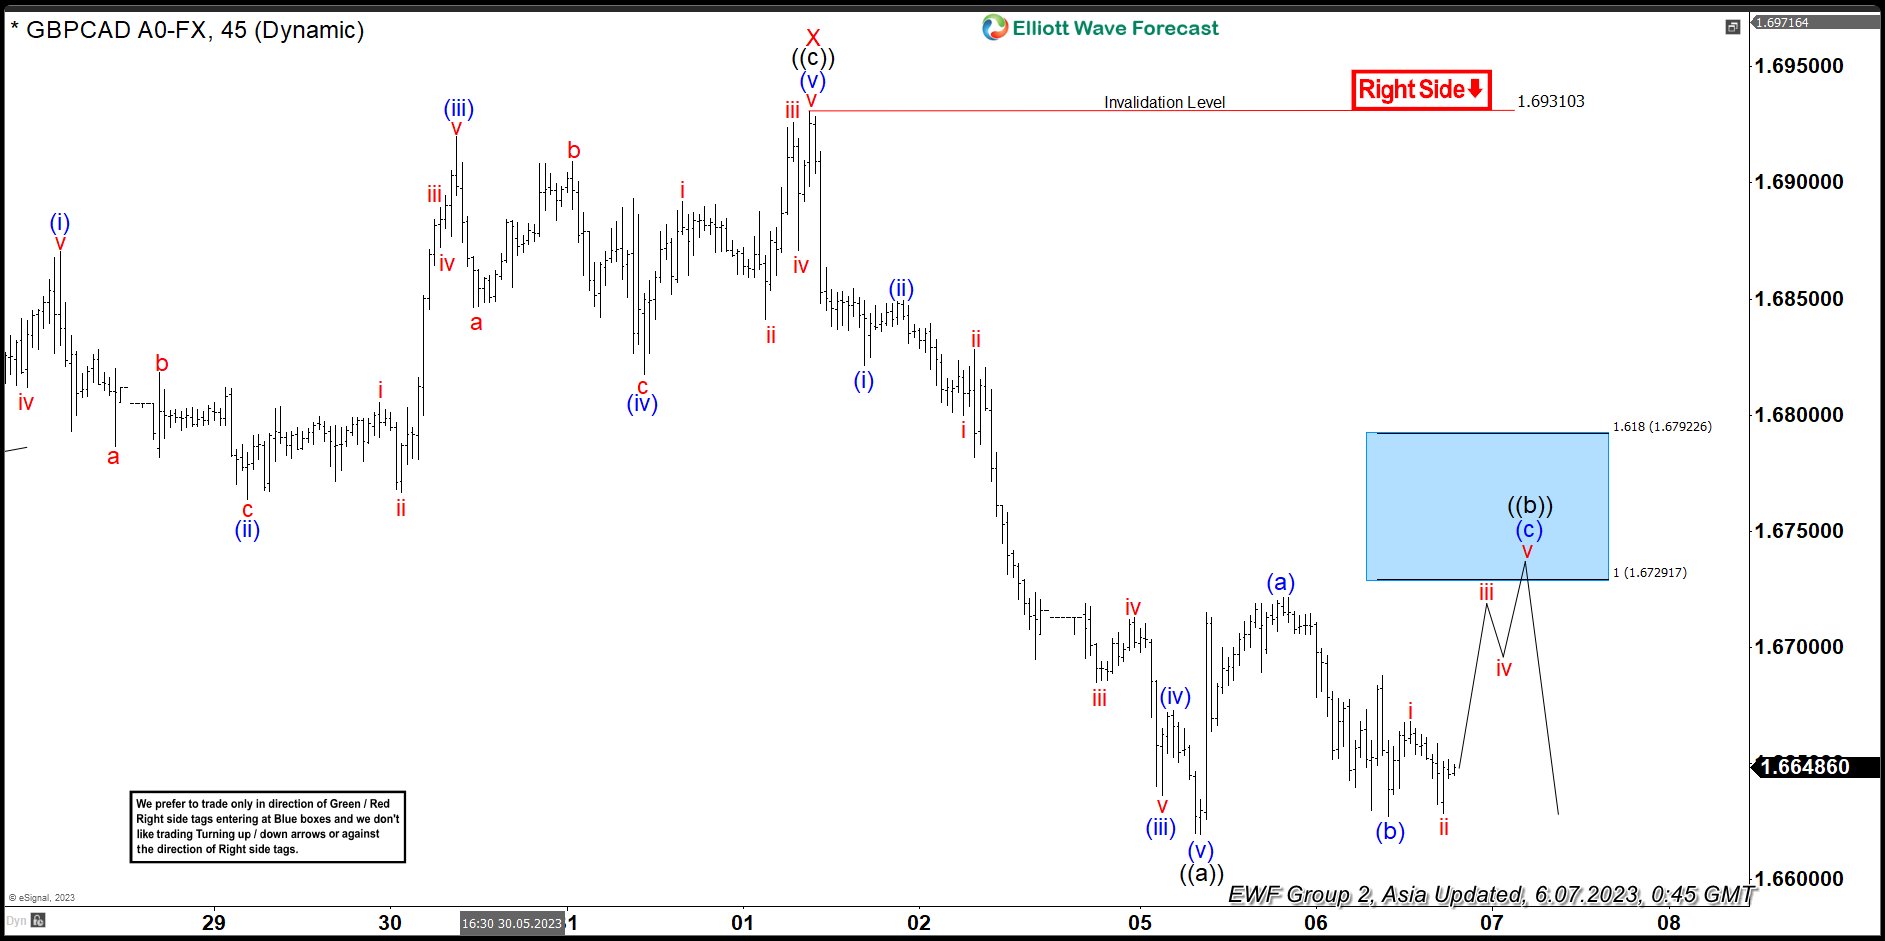
GBPCAD 1h Hour Asia Elliott Wave Analysis 06.07.2023
GBPCAD is giving us short term red recovery against the 1.6931 high. Correction is unfolding as Elliott Wave Zig Zag Pattern with (a)(b)(c) blue inner labeling. So far rally from the lows looks like 5 waves, so we expect to see another 5 waves up in (c) blue leg. Target area is marked as a Blue Box : 1.6729-1.6792 on the chart and that is our selling zone. At the marked area buyers should be ideally taking profits and sellers can appear again. Consequently , we expect to see reaction from that zone. The pair can make either decline toward new lows or larger 3 waves pull back at least. Once pull back reaches 50 Fibs against the (b) blue low, we will make short position risk free ( put SL at BE) and take partial profits. Break of 1.618 fib extension: 1.6792 would invalidated the trade.
You can learn more about Elliott Wave Zig Zag Patterns at our Free Elliott Wave Educational Web Page.
Reminder on how to trade EWF Charts :
Red bearish stamp+ blue box = Selling Setup
Green bullish stamp+ blue box = Buying Setup
Charts with Black stamps are not tradable. 🚫
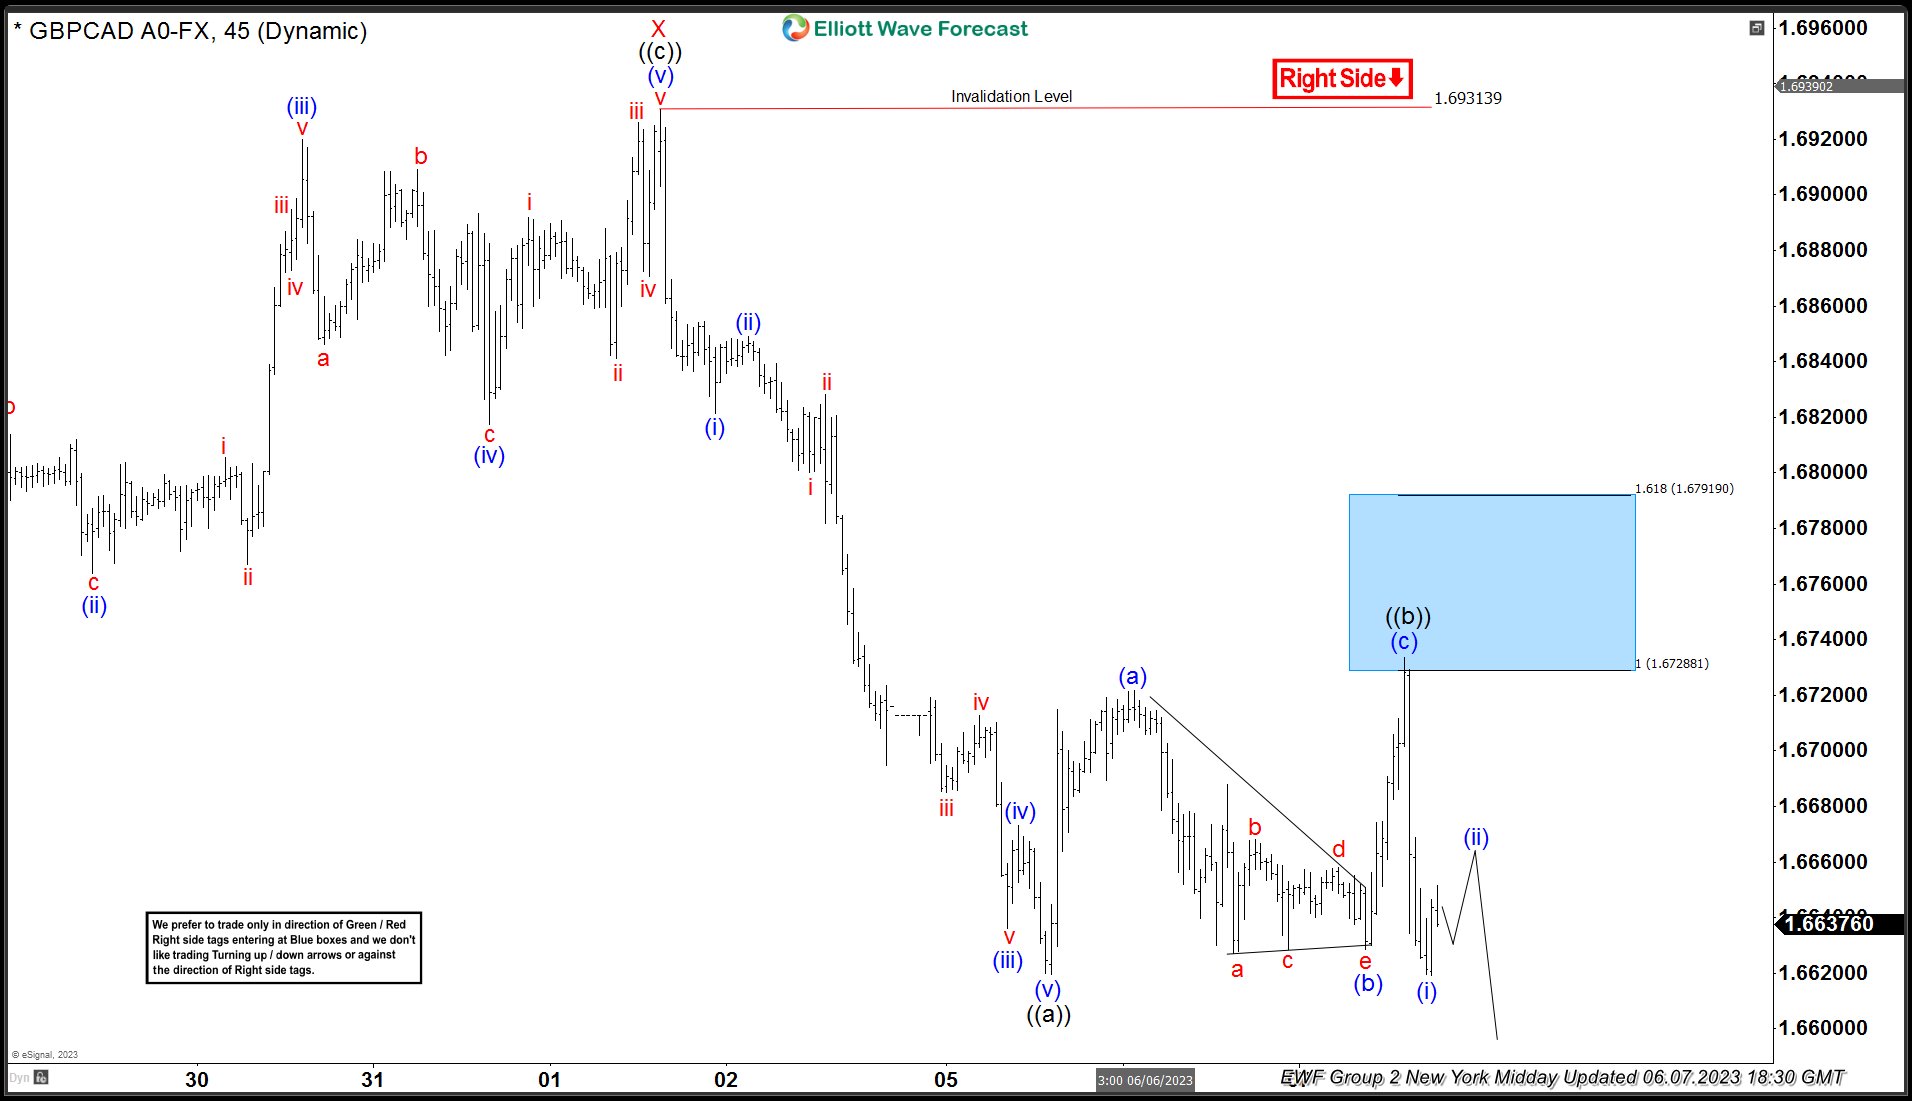
GBPCAD 1h Hour New York Midday Elliott Wave Analysis 06.07.2023
The pair found sellers right at the blue box and made decline from there toward new lows. At this stage we see the pair remains bearish against the 1.6931 pivot. Decline from the peak looks to be unfolding as 5 waves. As far as the price holds below 1.6733 level, short term recovery ((b)) can be done there. Otherwise, if we get strong reaction to the upside and 1.6733 peak gives up, then the pair could make irregular Flat pattern against the 1.69313 peak. Anyway, members who took short trades have made positions risk free. They have Put Stop Loss at entry level and took partial profits.
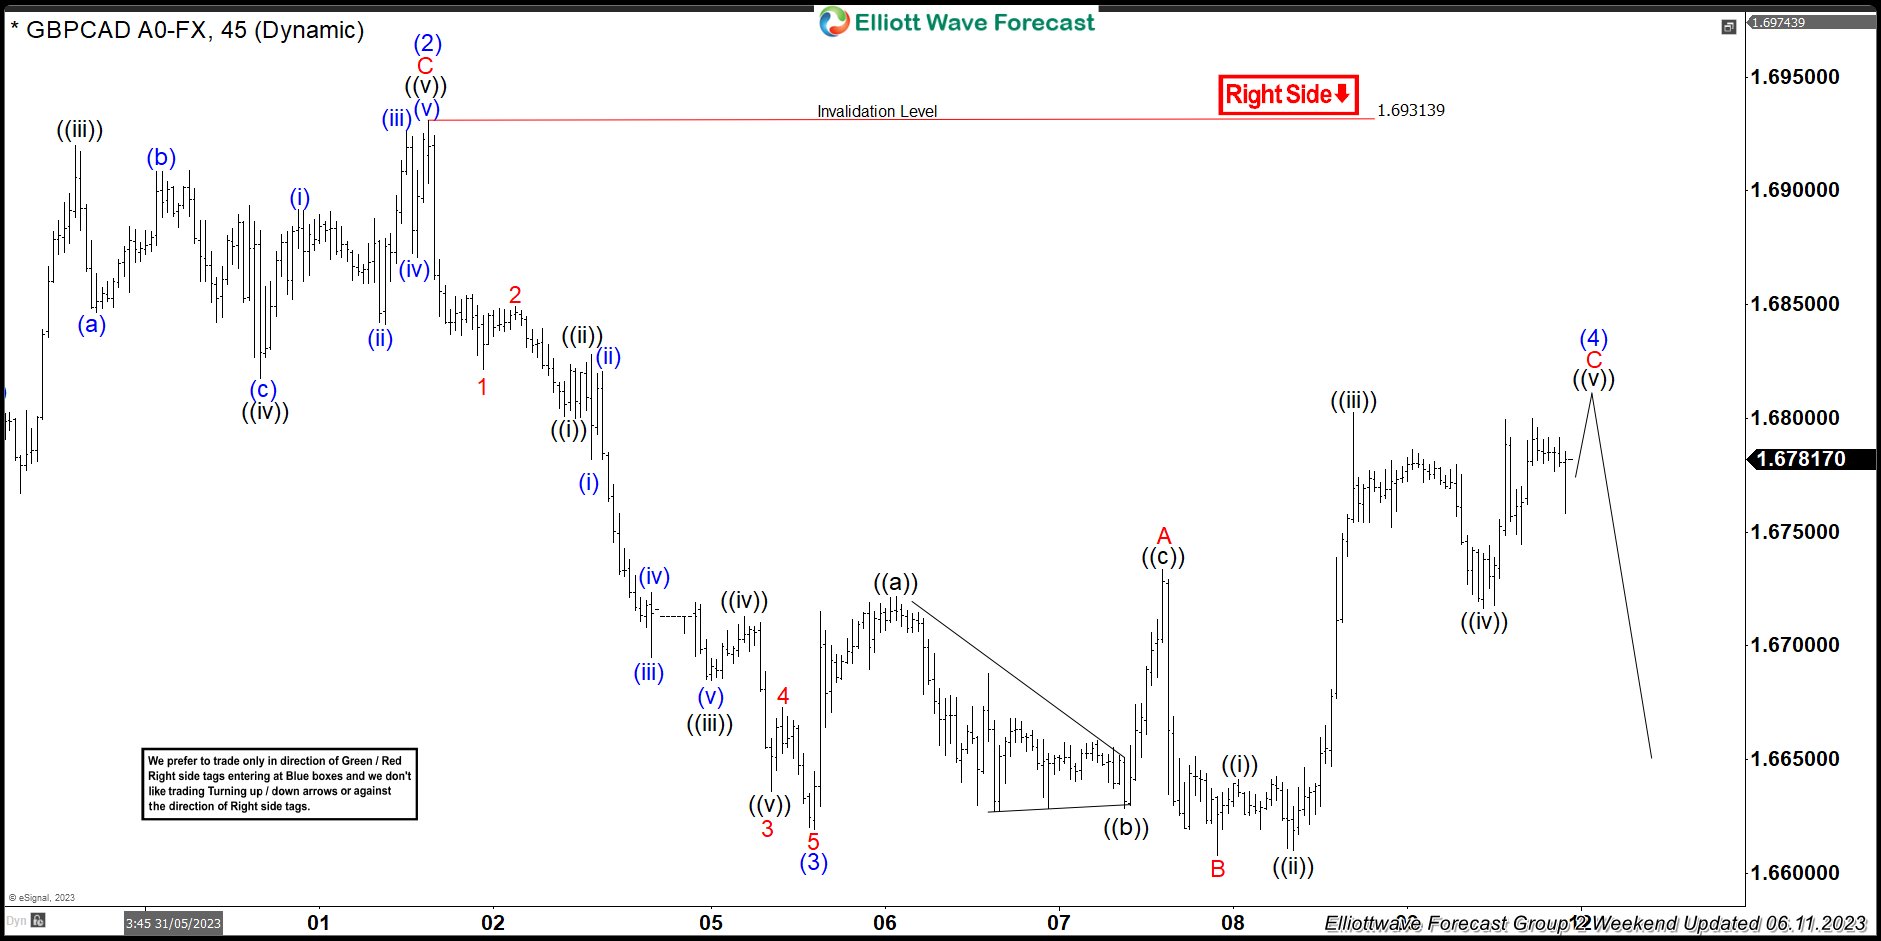
GBPCAD 1h Hour Weekend Elliott Wave Analysis 06.11.2023
The pair has taken alternative path. It made sharp rally and broke the previous high. We assume correction against the 1.6931 high is still in progress as potential Elliott Wave Flat pattern. Keep in mind there is no Blue Box on the chart at the moment, so don’t like forcing the trades at the current levels. When looking for a trade, corrections against the trend should be Double Three or Zigzag, that can give us clear entries and invalidation levels. We avoid Triple Threes and especially Flat structures for trading purpose as they are tricky to trade.
As you can notice, trading is not about being right all the time. We don’t make the market and our forecasts don’t have 100% accuracy. However we do have a system which allows us to get out Risk Free + cash partial profit from the trade, even if primary analysis gets wrong.
Source: https://elliottwave-forecast.com/trading/gbpcad-selling-rallies-blue-box/