
Hello Traders, in this article we will go through how EURAUD reacted higher after reaching a blue box area. Here at Elliott Wave Forecast we have in place a system that allows us to measure an area in which we can expect a react to take place. We call it equal legs area or blue box area as you might have seen within our charts.
These areas provide us with at least an 85% chance of a minimum of 3 waves bounce or reaction to take place. Consequently, we can use these areas to enter in the market with a defined entry, Stop Loss and exit strategy.
The pair has been trading within a larger degree cycle since 08.25.2022. In the near term cycle it has ended wave 1 of (3) on 04.13.2023 and a 3 waves pullback was then expected. Once we had establish the first leg lower in ((w)) and then connector bounce ((x)) we presented to our members the equal legs area to buy from. Let’s have a look on how we saw it during our Midday update on 04.17.2023.
EURAUD 1 Hour Midday update 04.17.2023
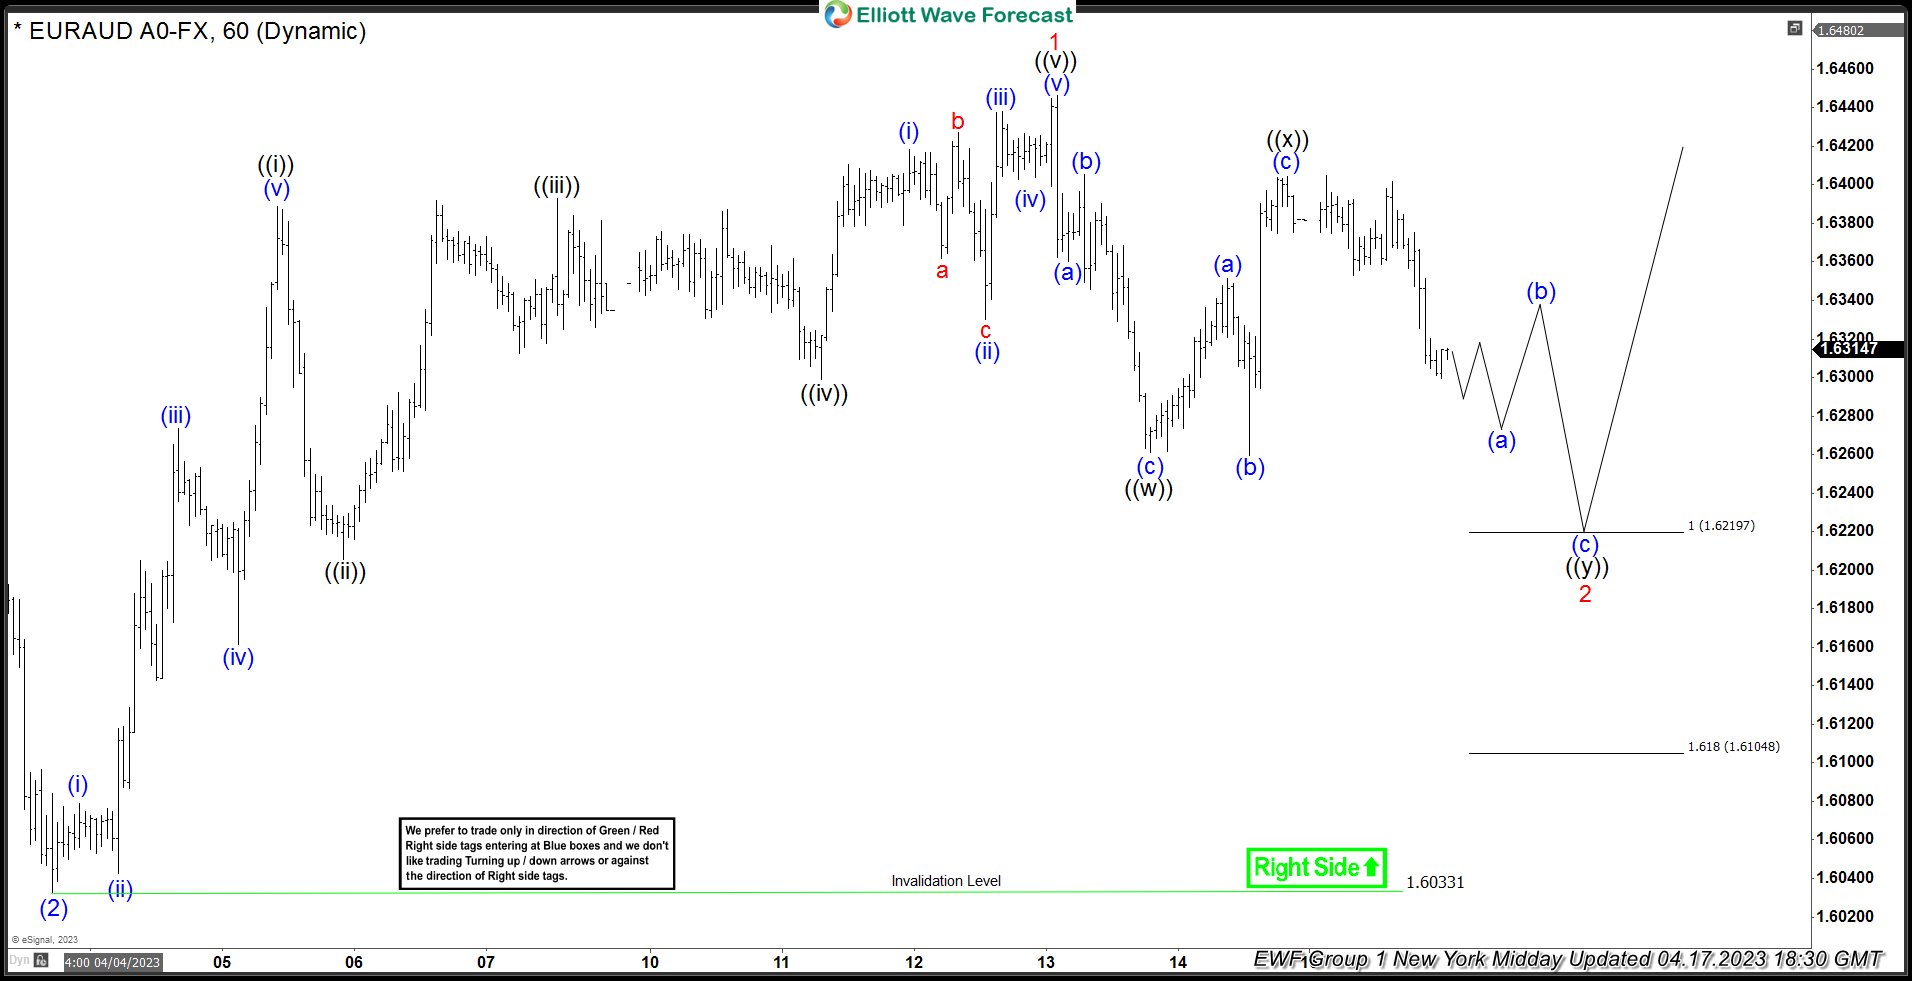
As we can see we were expecting then the last leg lower within wave ((y)) of 2 to end within 1.62197 – 1.61048 equal legs area. From there we are expecting the pair to find support for wave 3 of (3).
Now let’s see how it has reached the area and what is the latest update from 04.25.2023 Asia update.
EURAUD 1 hour Asia update 04.25.2023
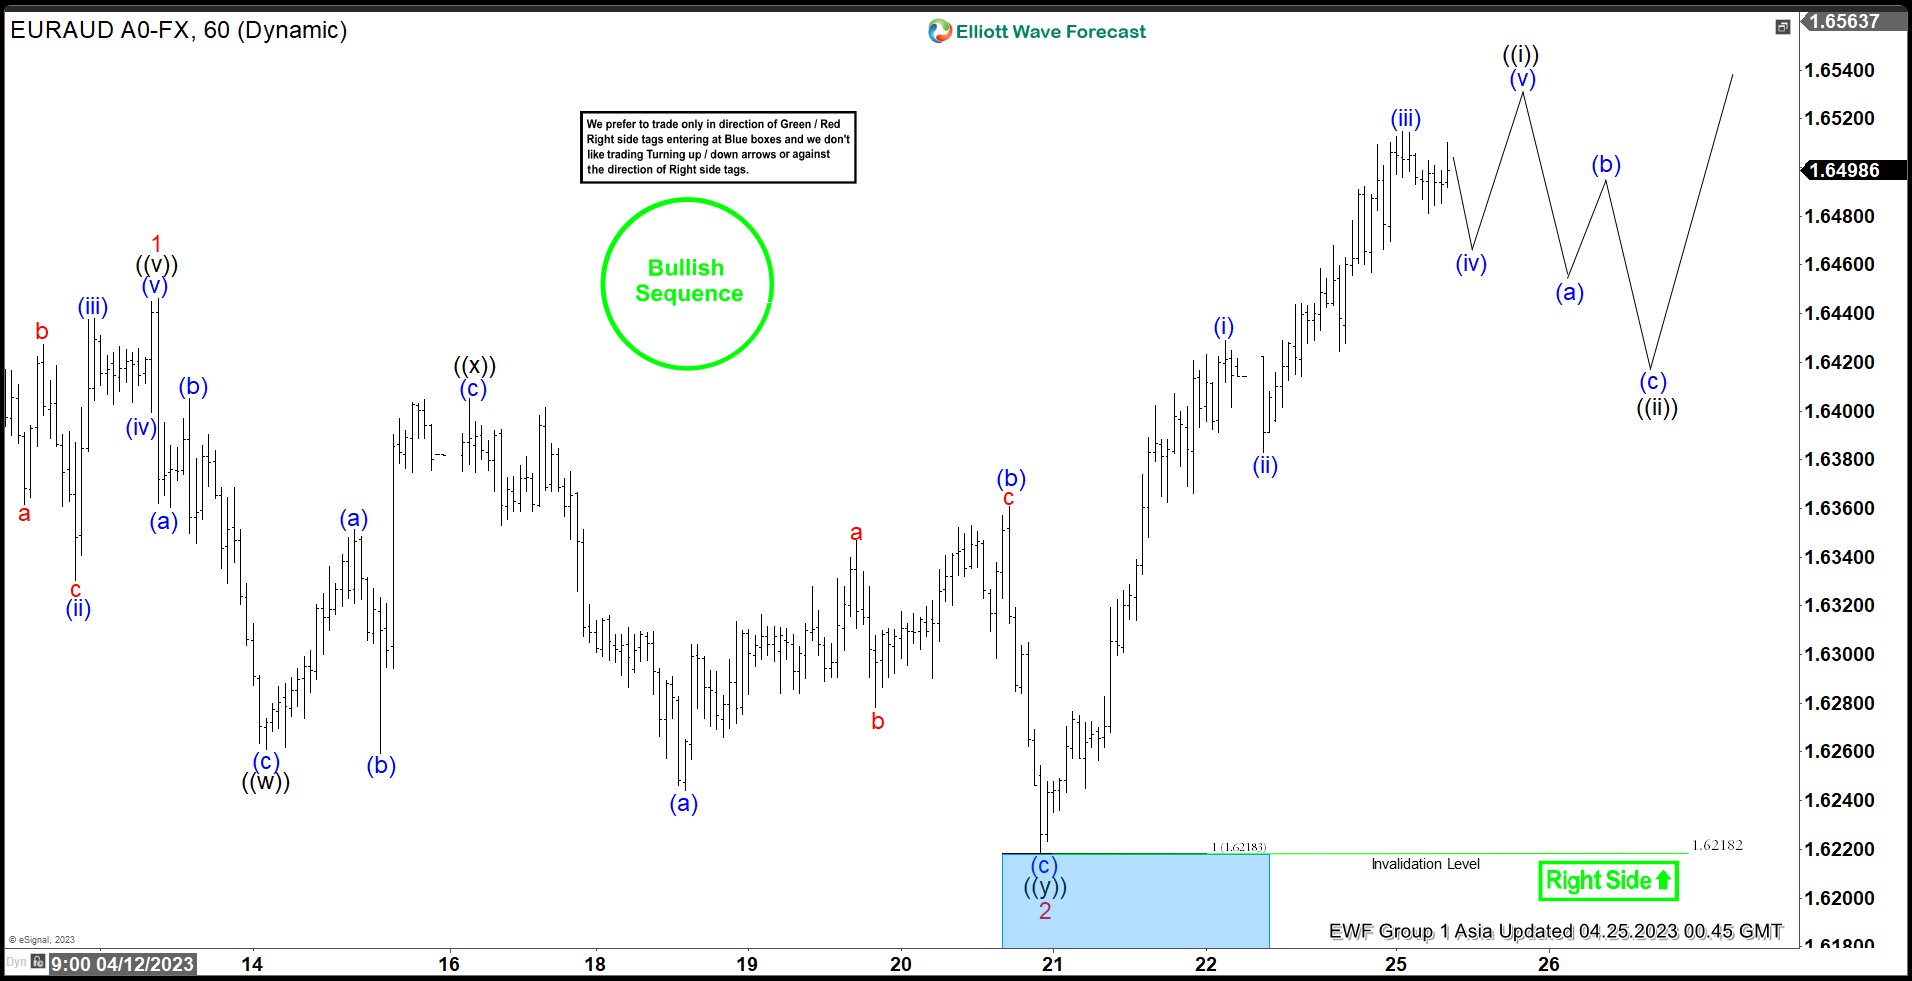
The pair has touched the equal legs area at 1.62182 and already reacted higher within wave ((i)) of 3 with one more high expected in (v) to end ((i)) before a 3 waves pullback in ((ii)) to follow. As a result now the trade should be set risk free after the reaction and letting it play out with the set target for wave 3 or short term traders can already take profit. Wave ((ii)) pullback should find support above 1.62182 for wave ((iii)) of 3 higher.
Source: https://elliottwave-forecast.com/forex/euraud-wave-2-found-buyers-at-blue-box-area/