
Hello Traders. In today’s article, we will look at the past performance of 4 Hour Elliott Wave chart of Bank of America ($BAC). The decline from 2.07.2023 peak unfolded as 5 swings and made a lower low on 3.24.2023 which created a bearish sequence in the 4H timeframe. Therefore, we knew that the structure in $BAC is incomplete to the downside & should see more downside in 3 or 7 swings against 2.07.2023 peak. So, we advised members to sell the bounce in 3 swings at the blue box area. We will explain the structure & forecast below:
$BAC 4H Elliott Wave Chart 4.16.2023:
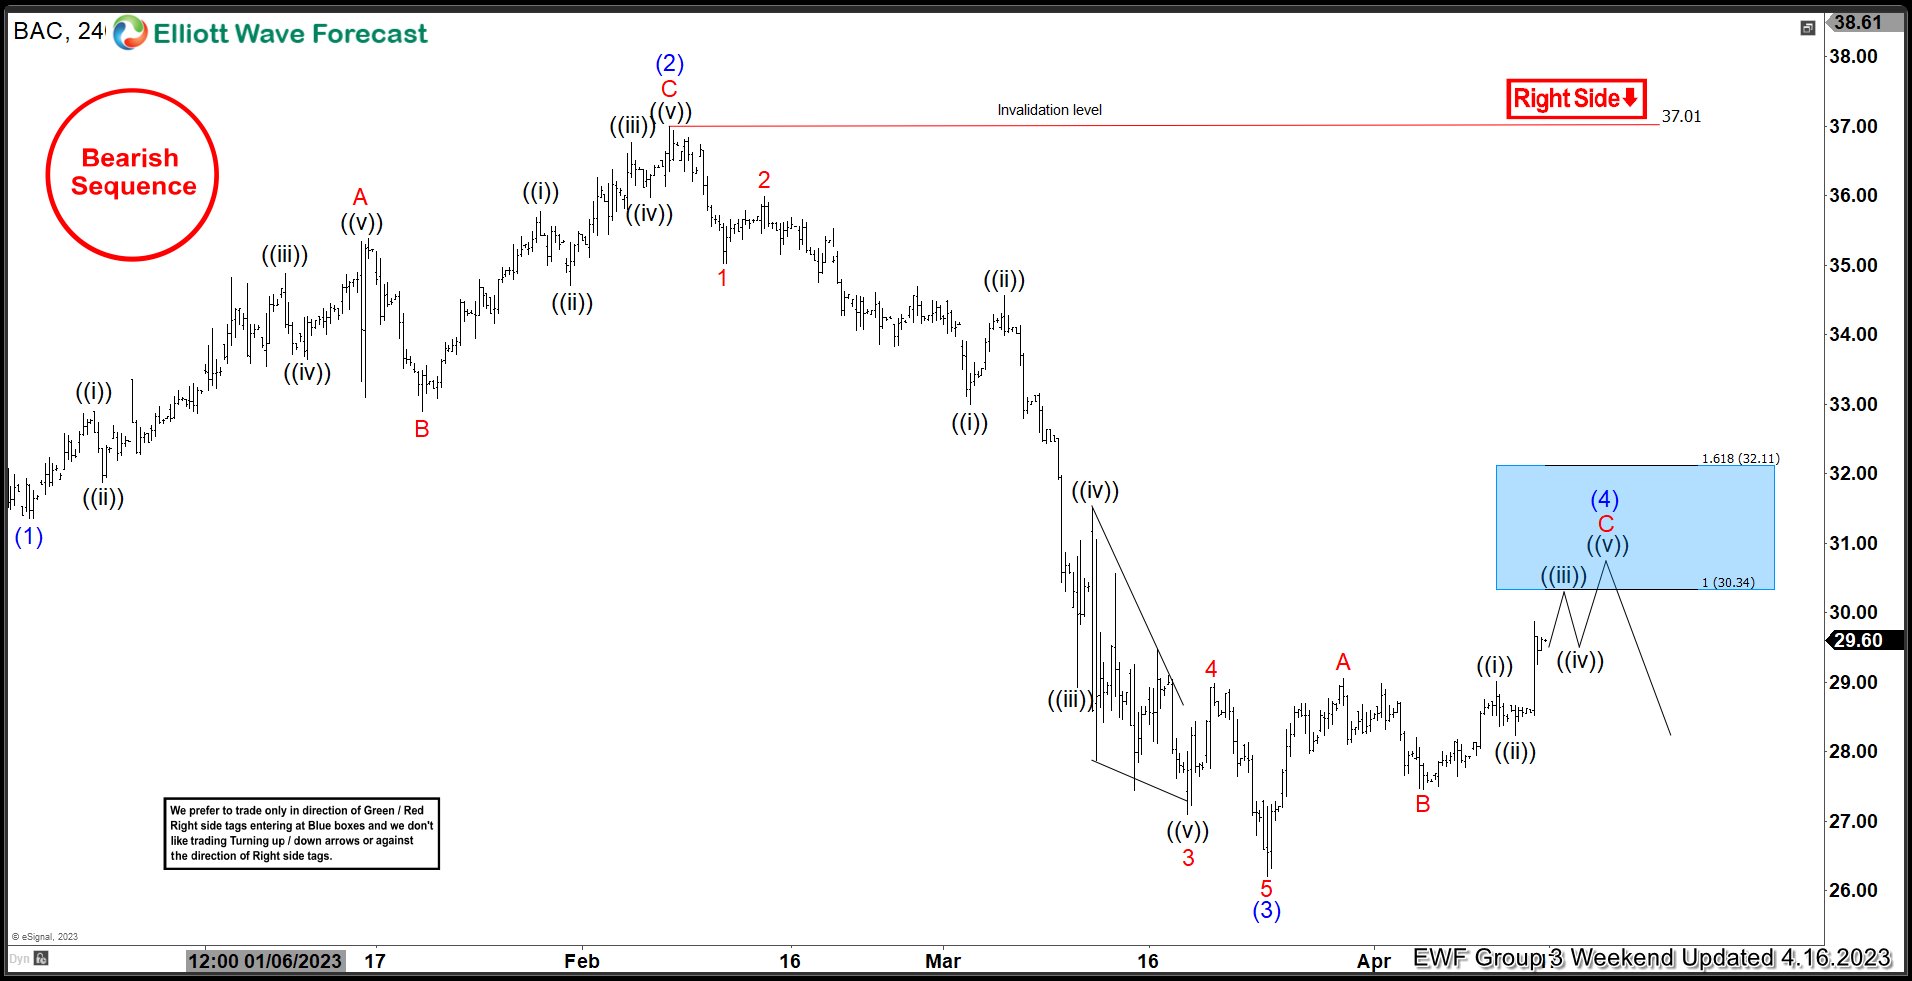
Here is the 4H Elliott Wave count from 4.16.2023. The decline from 2.07.2023 unfolded in a 5 wave impulse breaking below 10.13.2022 low creating a bearish sequence. We were calling for the bounce to fail in 3 swings where we like to sell it at the equal legs at $30.34 with a stop at $32.11.
$BAC Elliott Wave Chart 4.19.2023:
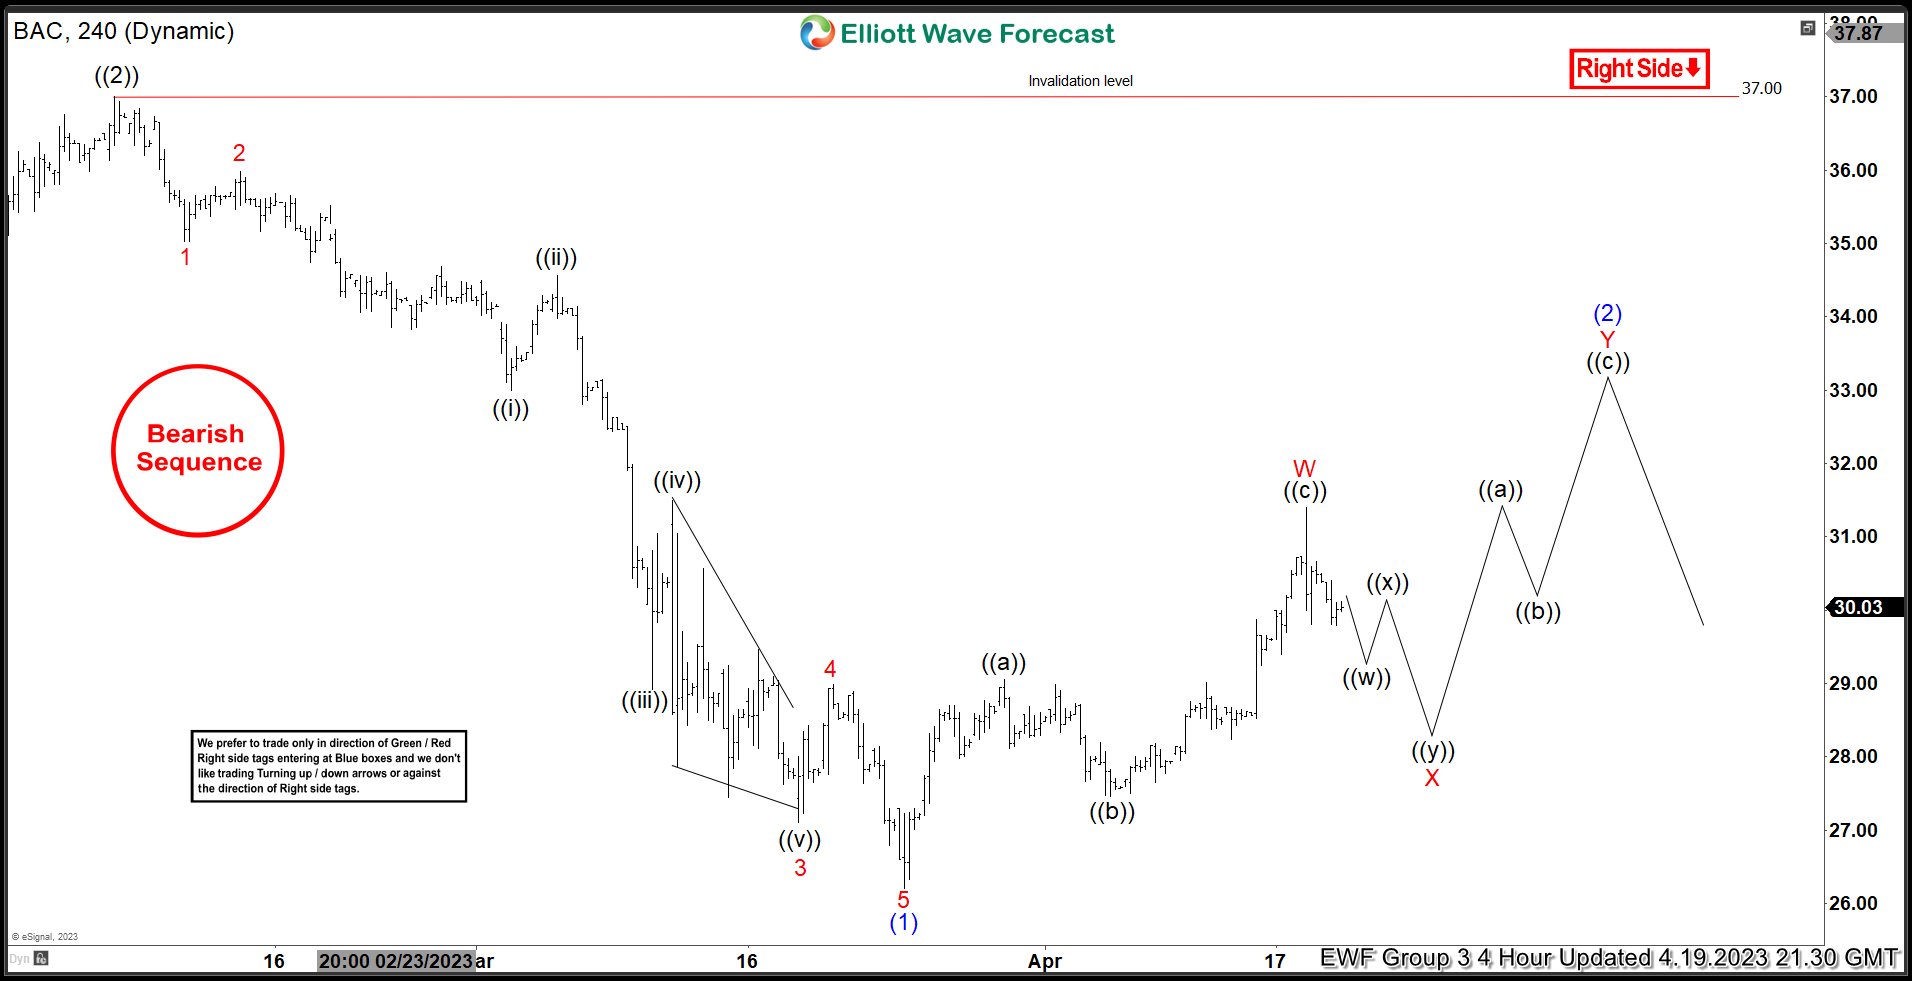
Here is the 4.19.2023 4H update showing the move taking place as expected. The stock has reacted lower ending the cycle from 3.24.2023 low. It reached the 50% back from black ((b)) allowing any shorts to get risk free shortly after taking the position.
The market is dynamic and constantly changing. With that said, the overall market correlation is calling for a 7 swings correction to take place instead of 3 so we advised our members that the structure has changed. We like to sell the next blue box area in 7 swings when the opportunity presents itself.
Source: https://elliottwave-forecast.com/stock-market/bank-america-bac-reacts-lower-blue-box-area/