Hello fellow traders. In this technical blog we’re going to take a quick look at the Elliott Wave charts of General Electric ( GE ), published in members area of the website. As our members know, GE has recently given sideways correction in wave (4) that has completed as Elliott Wave Triangle pattern. The stock made the rally after completing the sideways correction. In the further text we are going to explain the Elliott Wave Pattern and the forecast.
Before we take a look at the real market example, let’s explain Elliott Wave Triangle Pattern
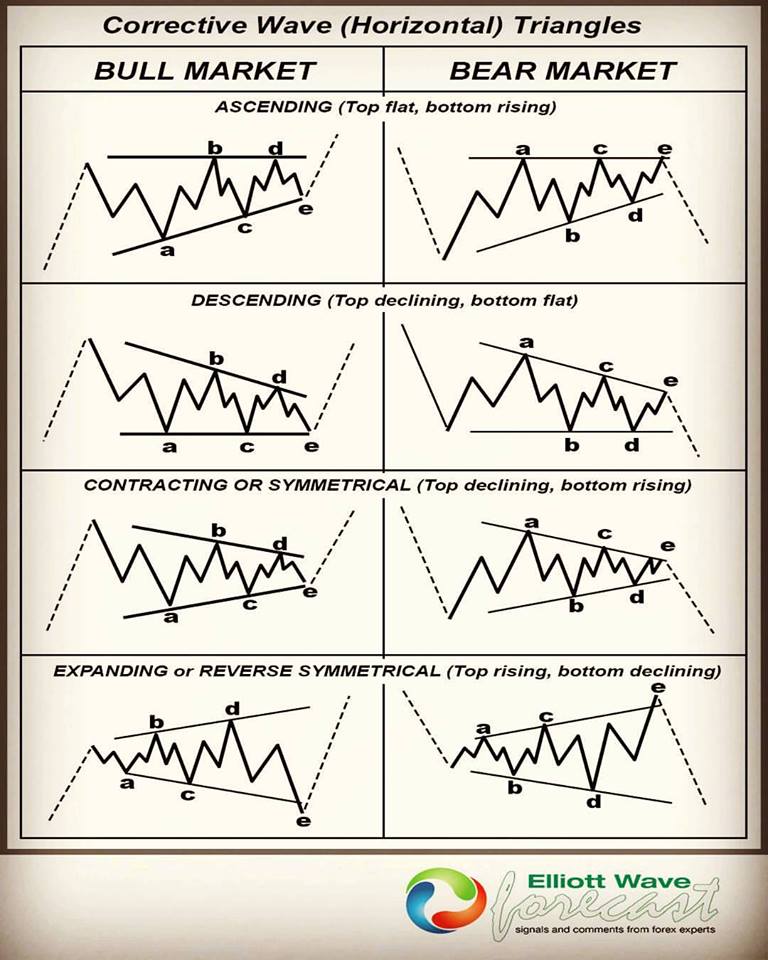
Elliott Wave Triangle pattern is the corrective pattern in Elliott Wave theory . It is a sideways movement that is associated with decreasing volume and volatility. Triangles have 5 sides and each side is subdivided in corrective 3 waves hence forming 3-3-3-3-3 structure. Triangle pattern usually occurs in waves 4 or wave B. There are 4 types of triangles in Elliott Wave Theory: Ascending, descending, contracting, and expanding. They are illustrated in the graphic below
If you are new to Elliott Wave we recommend you to check out our Free Elliott Wave Educational Web Page and download our Free Elliott Wave Book.
At the chart below we can see what Elliott Wave Triangle pattern looks like in real market.
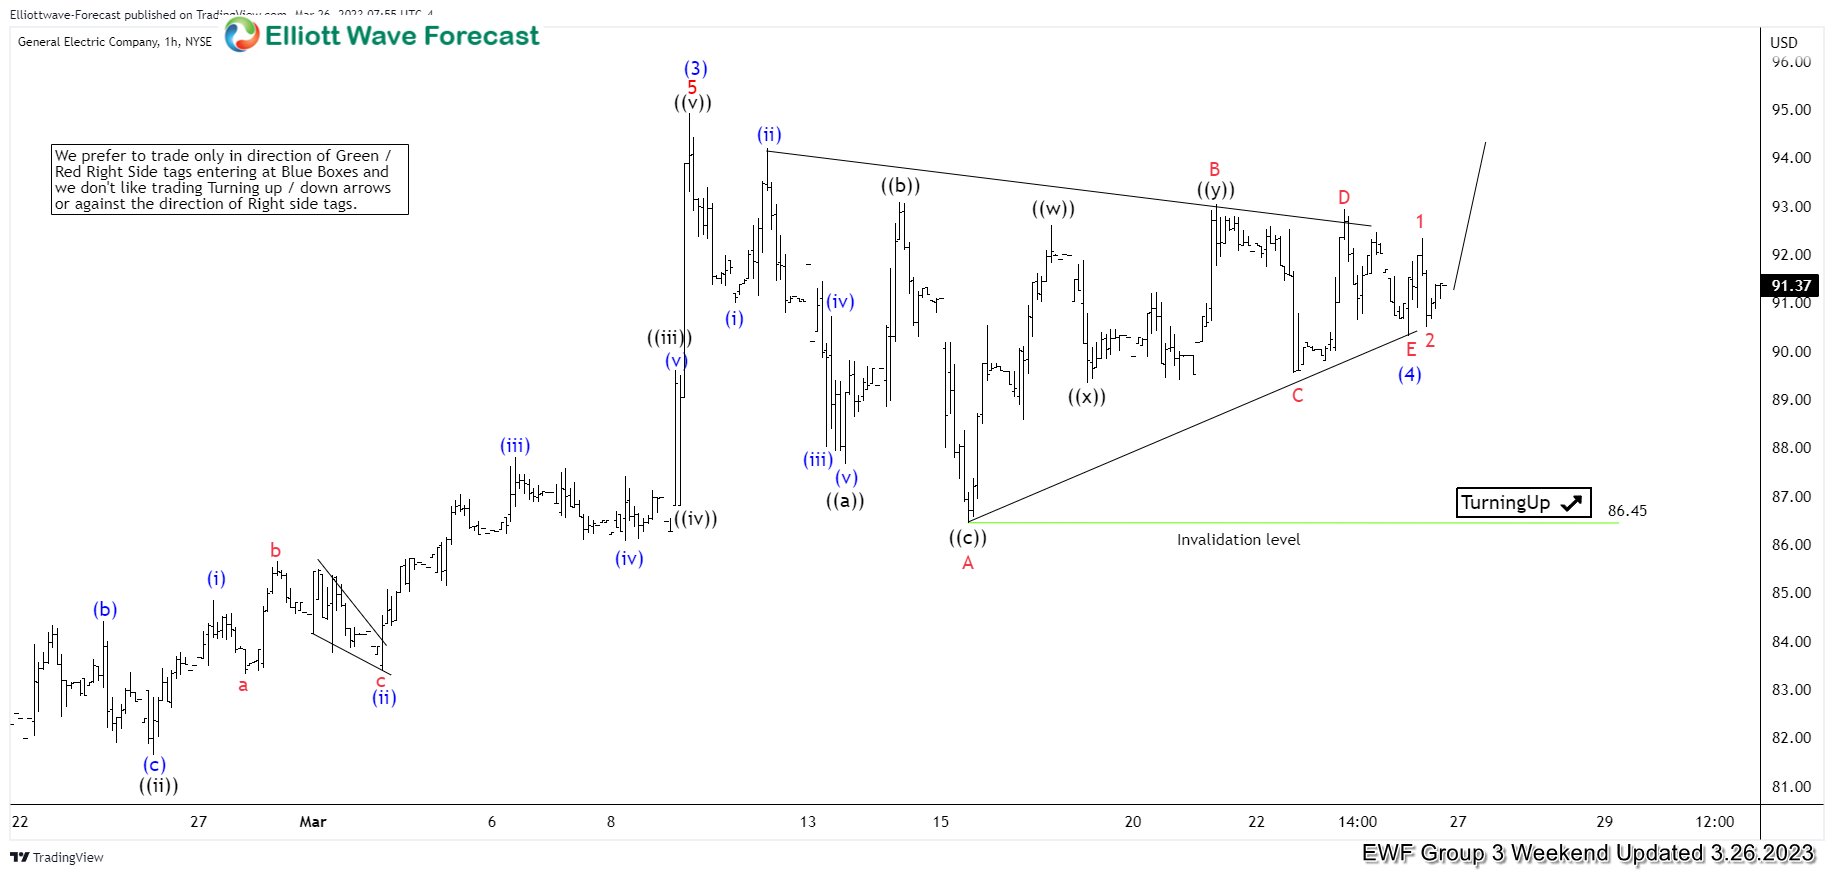
GE H1 London Update 03.26.2023
GE has given us sideways consolidation in wave (4) blue correction. We got sideways consolidation, the stock made contractions in both price and momentum. Now, we can count clear 5 waves within the pattern. Each one has corrective sequences. Consequently we believe that wave (4) could have ended as a Triangle Pattern. We are looking for further strength in the stock. Once we get break of (3) blue peak, the price will confirm that next leg up is in progress toward 96.18-98.2 area.
Reminder : You can learn more about Triangles and other Elliott Wave Patterns at our Free Elliott Wave Educational Web Page.
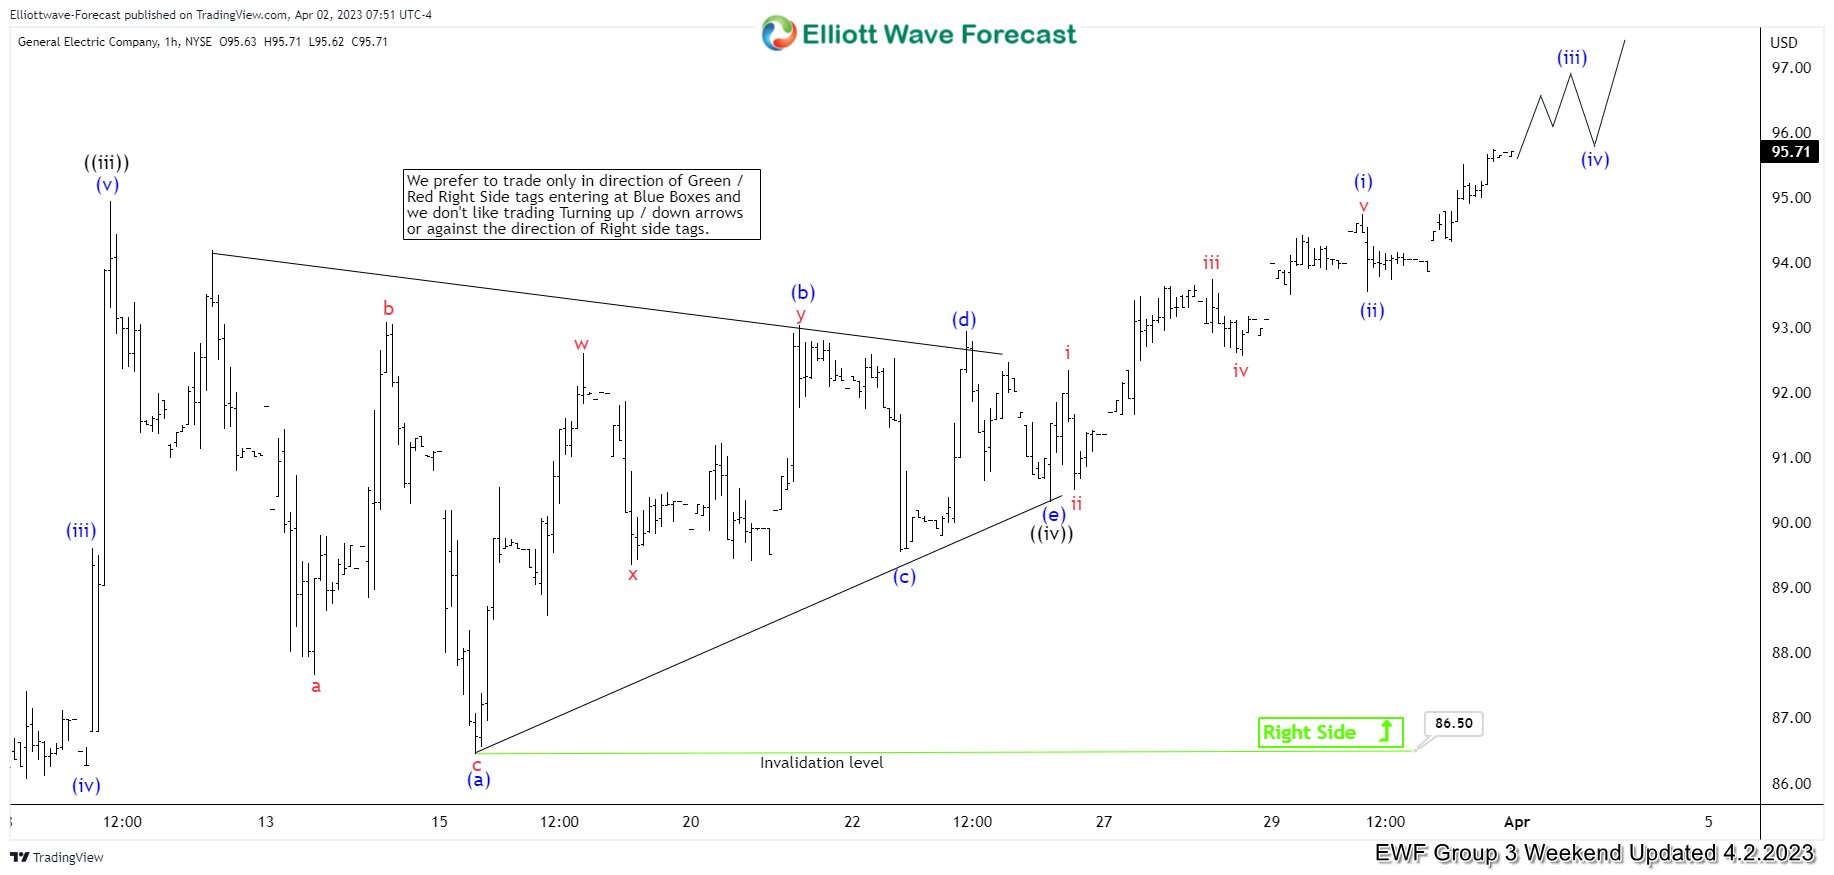
GE H1 London Update 04.02.2023
The price break upper line of triangle. As a result we got continuation higher as expected. Once the stock broke previous peak at 94.9, we got confirmation that we should ideally see extension up toward 96.18-98.2 area at least.
Keep in mind that market is dynamic and presented view could have changed in the mean time. You can check most recent updates in the membership area of the website. Remember that not every chart is trading recommendation. Best instruments to trade are those having incomplete bullish or bearish swings sequences. We put them in Sequence Report and best among them are shown in the Live Trading Room. You can check most recent charts in the membership area of the site.