
Hello Traders, in this article we will analyze our forecast of the Nasdaq Futures in the short term cycle. Since the short term peak of NQ_F from 02.02.2023 to end wave 1 we have been expecting a pullback within wave 2 to take place. Here at Elliott Wave Forecast we have in place a system that allows us to measure an area in which we can expect a react to take place. We call it equal legs area or blue box area as you might have seen within our charts. These areas provide us with at least an 85% chance of a minimum of 3 waves bounce or reaction to take place. We can use these areas to enter in the market with a defined entry, Stop Loss and exit strategy.
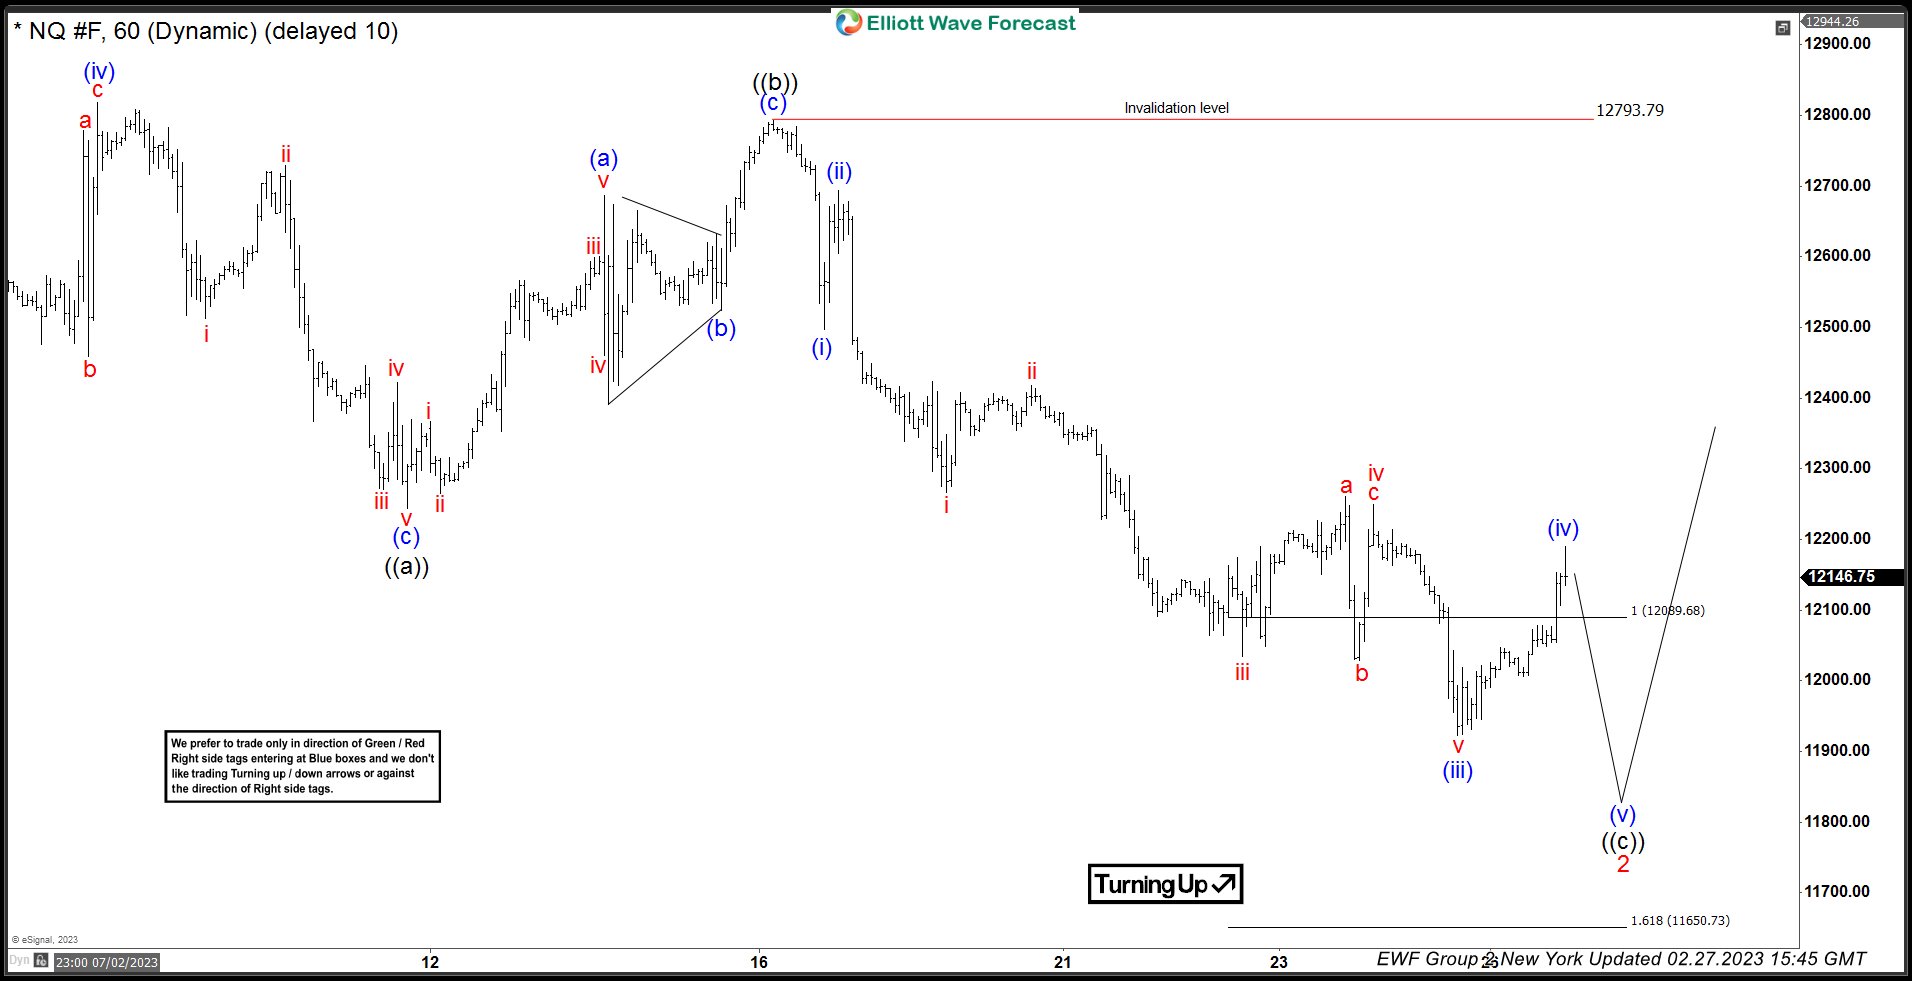
We teach how to use our system within our member’s area and live trading room. Once a member or in trial you will be able to gather more of that information under your disposal. Nevertheless, let’s have a look now on the 1 hour chart of Nasdaq futures as provided to members from 02.27.2023. We have been within the equal legs area within a swing lower missing to end the cycle.
NQ_F 1 Hour New York update 02.27.2023
As we can see the market has bounced within wave (iv) of ((c)) and we have been forecasting one more leg lower within wave (v) of ((c)) to end wave 2 within equal legs area of 12089.68 – 11650.73 to end wave 2. Fast forwards towards the latest update now from 03.05.2023 weekend update we will see that the market has already reacted higher and what we expect next.
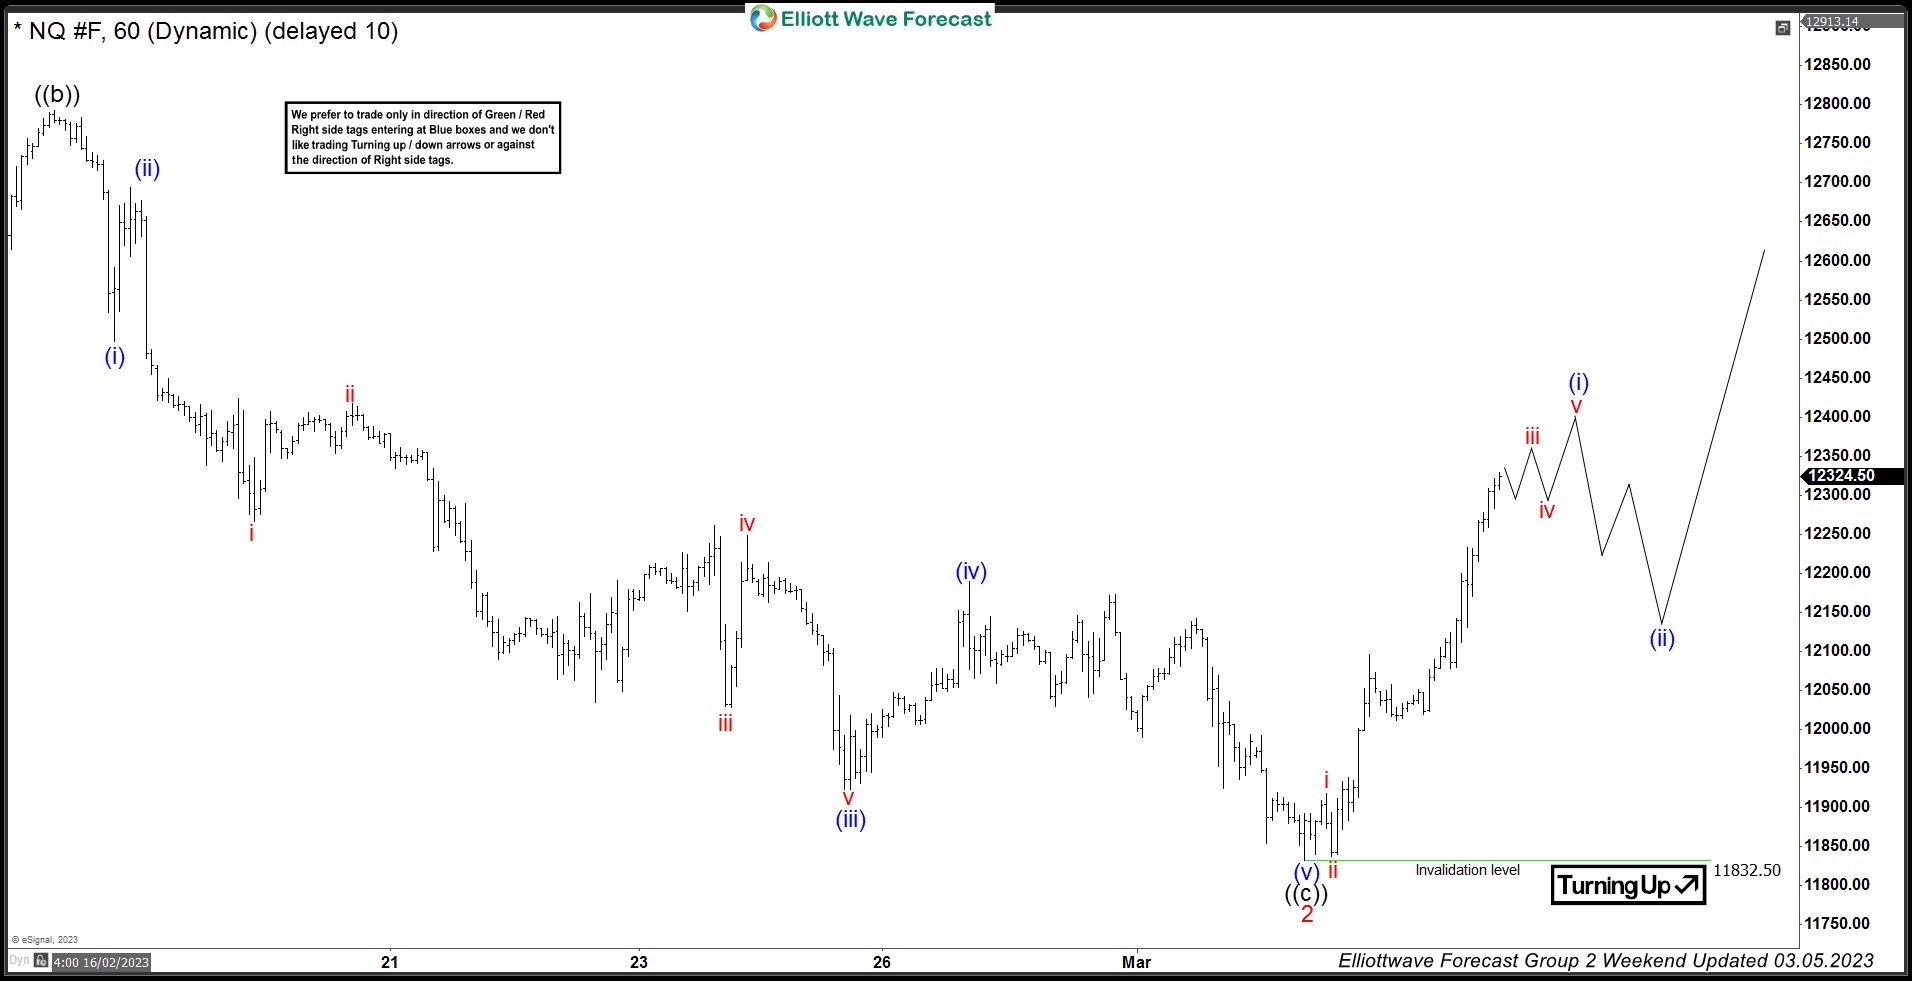
NQ_F 1 Hour Weekend update 03.05.2023
A very clear reaction higher started taking place from 03.02.2023 at the price of 11832.50. Reaction higher as an impulse within wave iii of (i) expecting a (iv) and a (v) to end wave (i). Afterwards a wave (ii) pullback is expected to take place before it can trade higher within wave (iii).
Source: https://elliottwave-forecast.com/stock-market/nq_f-reaction-higher-from-equal-legs-area/