
Hello fellow traders. In this technical article we’re going to take a look at the Elliott Wave charts charts of Wheat Futures ($ZW_F) published in members area of the website. As our members know Wheat Futures is trading within the cycle from the 950’6 peak. Recently ZW_F made short term recovery that has unfolded as Elliott Wave Double Three Pattern. It made clear 7 swings from the lows and complete at the extreme zone. In further text we’re going to explain the Elliott Wave pattern and forecast.
Before we take a look at the real market example, let’s explain Elliott Wave Double Three pattern.
Elliott Wave Double Three Pattern
Double three is the common pattern in the market , also known as 7 swing structure. It’s a reliable pattern which is giving us good trading entries with clearly defined invalidation levels.
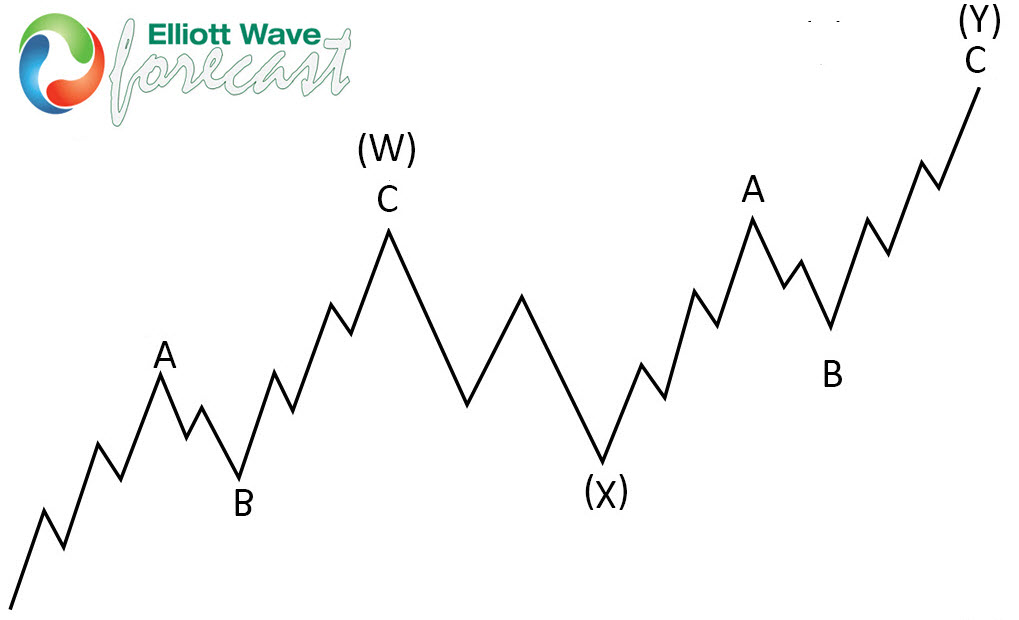
The picture below presents what Elliott Wave Double Three pattern looks like. It has (W),(X),(Y) labeling and 3,3,3 inner structure, which means all of these 3 legs are corrective sequences. Each (W) and (Y) are made of 3 swings , they’re having A,B,C structure in lower degree, or alternatively they can have W,X,Y labeling.
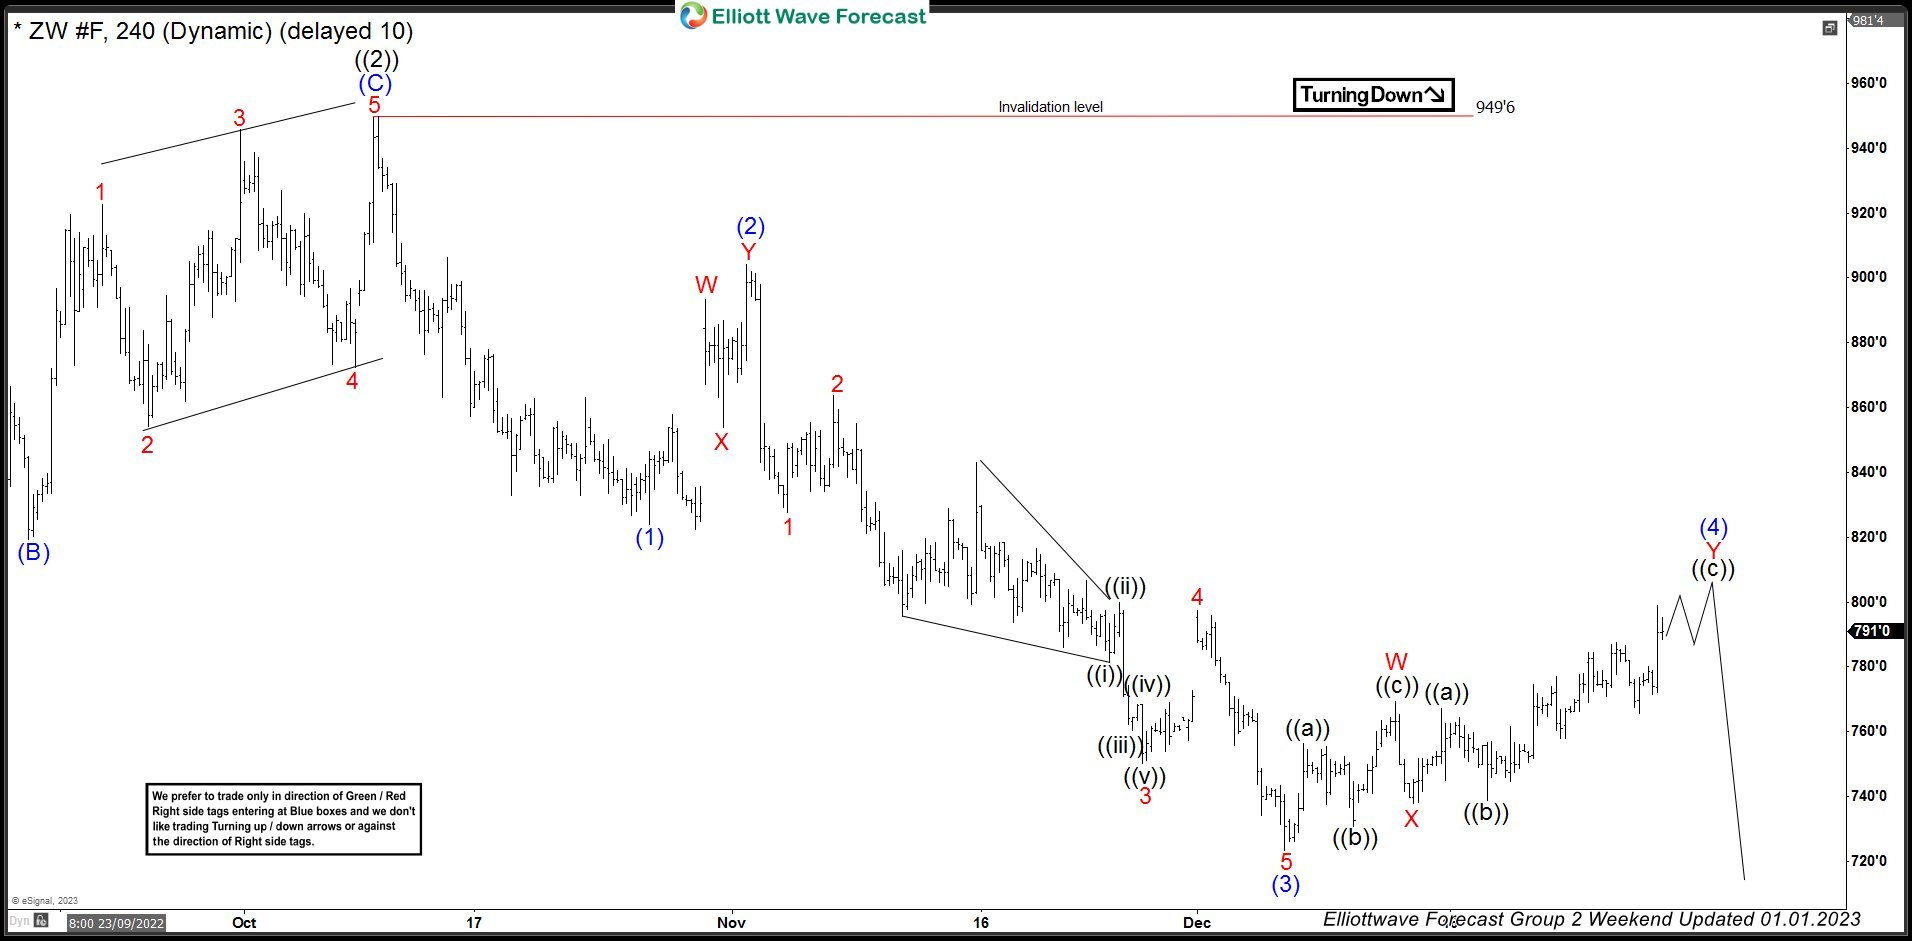
Wheat $ZW_F 4h Hour Elliott Wave Analysis 01.01.2023
Current view suggests cycle from the 949’6 peak is still in progress as 5 waves structure. Wheat is giving us (4) blue recovery that is unfolding as Elliott Wave Double Three Pattern with WXY red inner labeling. If we take a close look , we can see that price structure has already reached extremes from the lows at 782’6-810’6 ( W-X red equal legs area). At that zone buyers should be ideally taking profits and sellers can appear again. Consequently , we expect to see reaction from the marked area. From mentioned zone we can get either decline toward new lows or larger 3 waves pull back at least.
You can learn more about Elliott WaveDouble Three and Zig Zag Patterns at our Free Elliott Wave Educational Web Page.
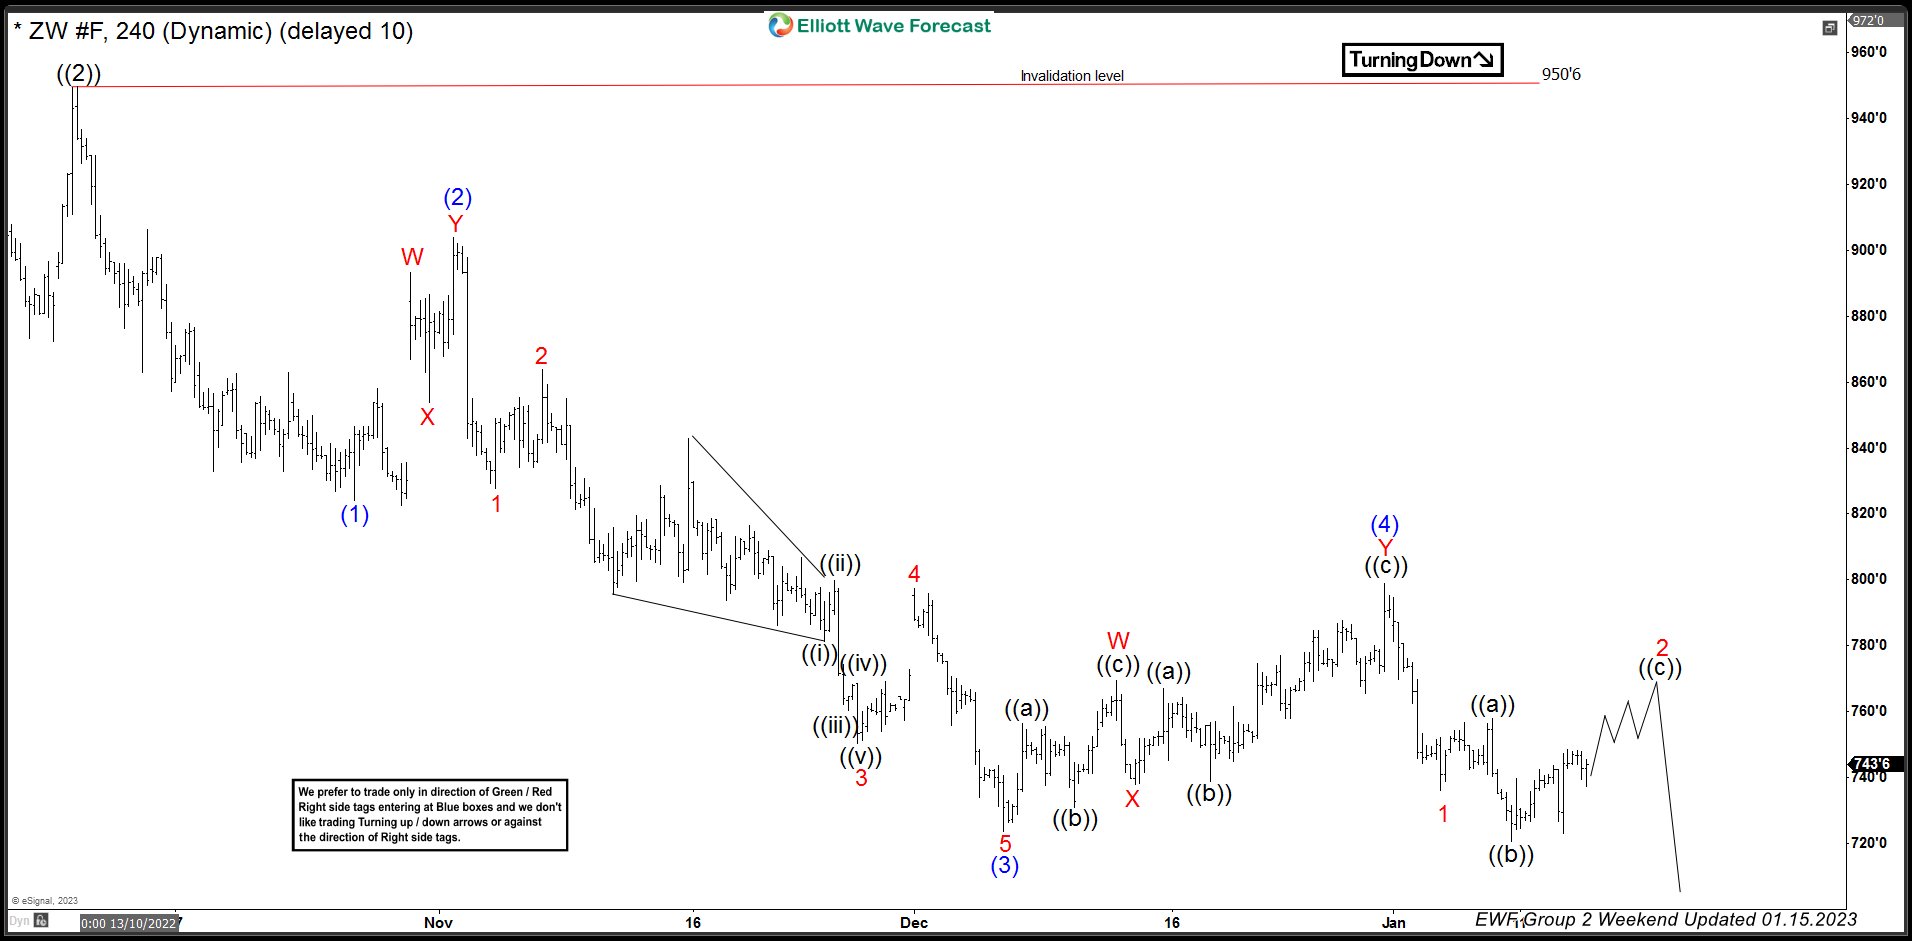
Wheat $ZW_F 4h Hour Elliott Wave Analysis 01.15.2023
Wave (4) completed at the mentioned area and we got good reaction. Current view suggests (4) blue recovery is done at 799’1 high. Currently the commodity is giving us short term bounce against that high, that can be unfolding as a Flat structure. The price now must hold below 799’1 peak in order to keep proposed view intact.
Keep in mind not every chart is trading recommendation. You can check most recent charts and new trading setups in the membership area of the site. Best instruments to trade are those having incomplete bullish or bearish swings sequences. We put them in Sequence Report and best among them are shown in the Live Trading Room.
Source: https://elliottwave-forecast.com/elliottwave/wheat-elliott-wave-double-three/