
Hello fellow traders. In this technical blog we’re going to take a quick look at the Elliott Wave charts of OIL . As our members know, break of 09/27 low made incomplete bearish sequences in the cycle from the June peak. Consequently we were calling for further extension down within the cycle. Recently the commodity has given us nice 3 waves bounce which found sellers right at equal legs area as we expected. In the further text we are going to explain the Elliott Wave Forecast
OIL H1 Elliott Wave Analysis 12.01.2022
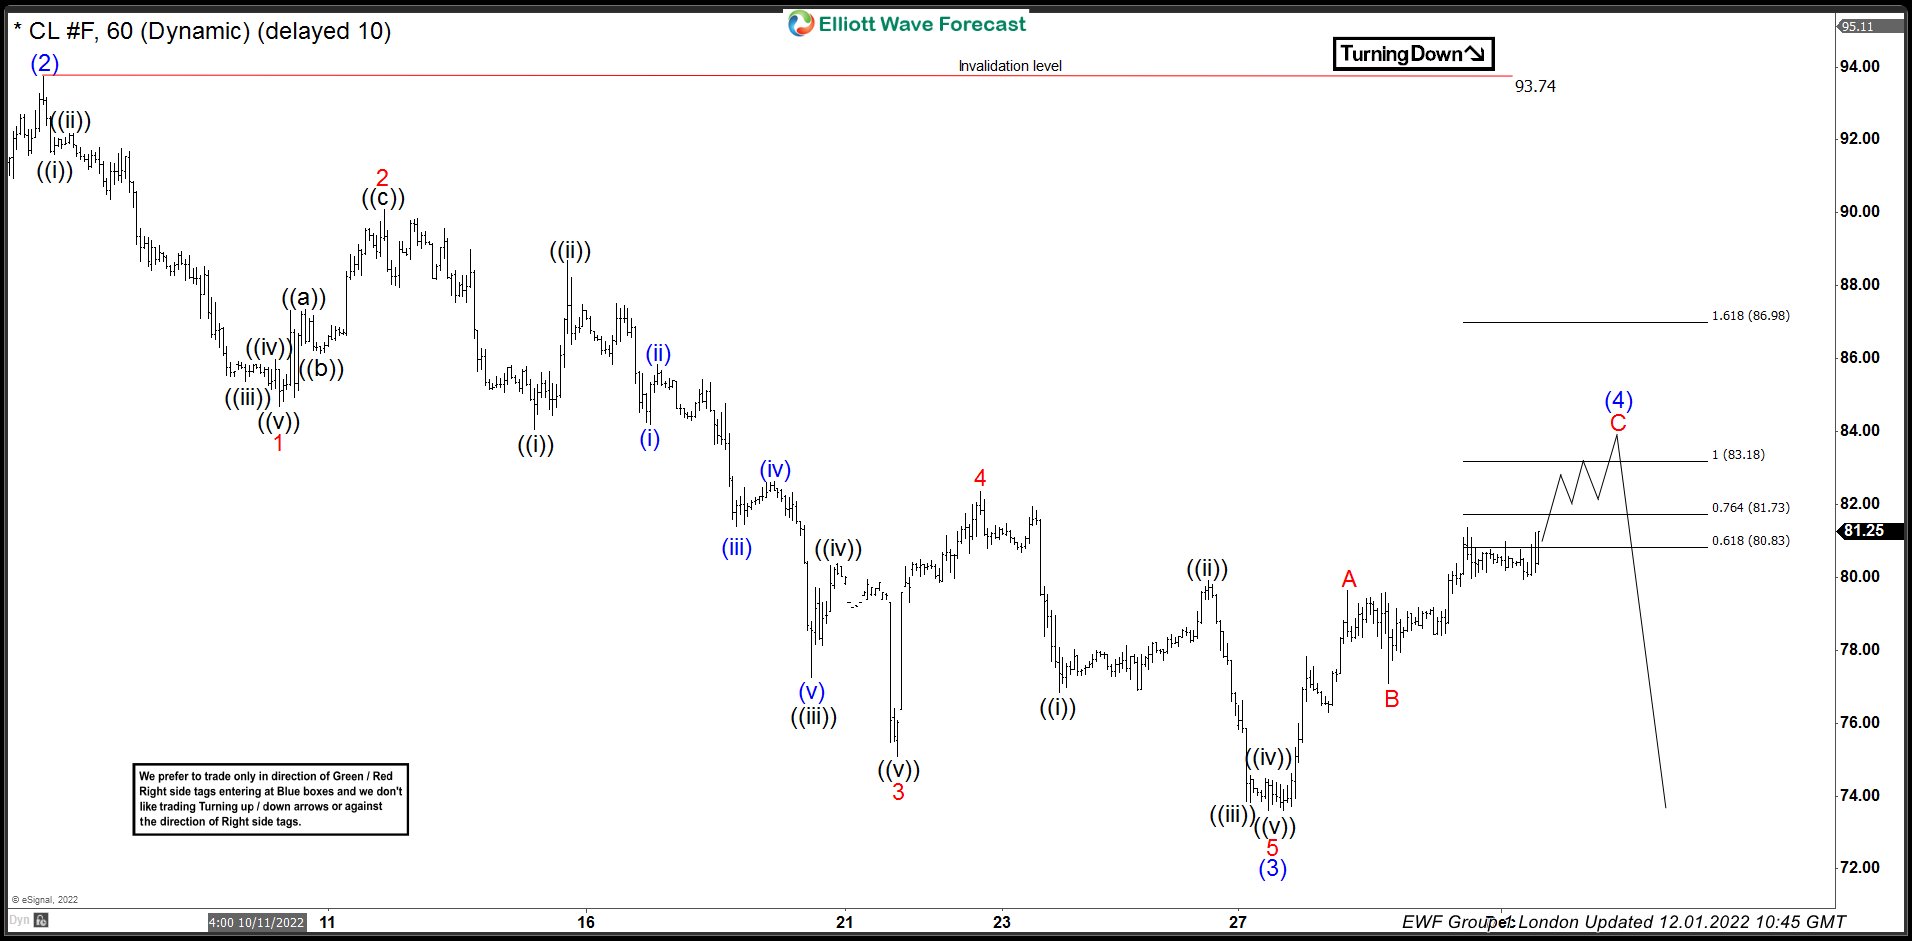
OIL is correcting the short term cycle from the 93.74 peak. Recovery looks incomplete at the moment. The price is showing higher high sequences from the low, looking for extension up toward 83.18-86.98 area. At that zone buyers should be ideally taking profits and sellers can appear again. Consequently , we expect to see reaction from the marked area. Once OIL reaches mentioned area it should ideally make either decline toward new lows or larger 3 waves pull back at least.
Reminder: You can learn about Elliott Wave Rules and Patterns at our Free Elliott Wave Educational Web Page.
OIL H1 Elliott Wave Analysis 12.05.2022
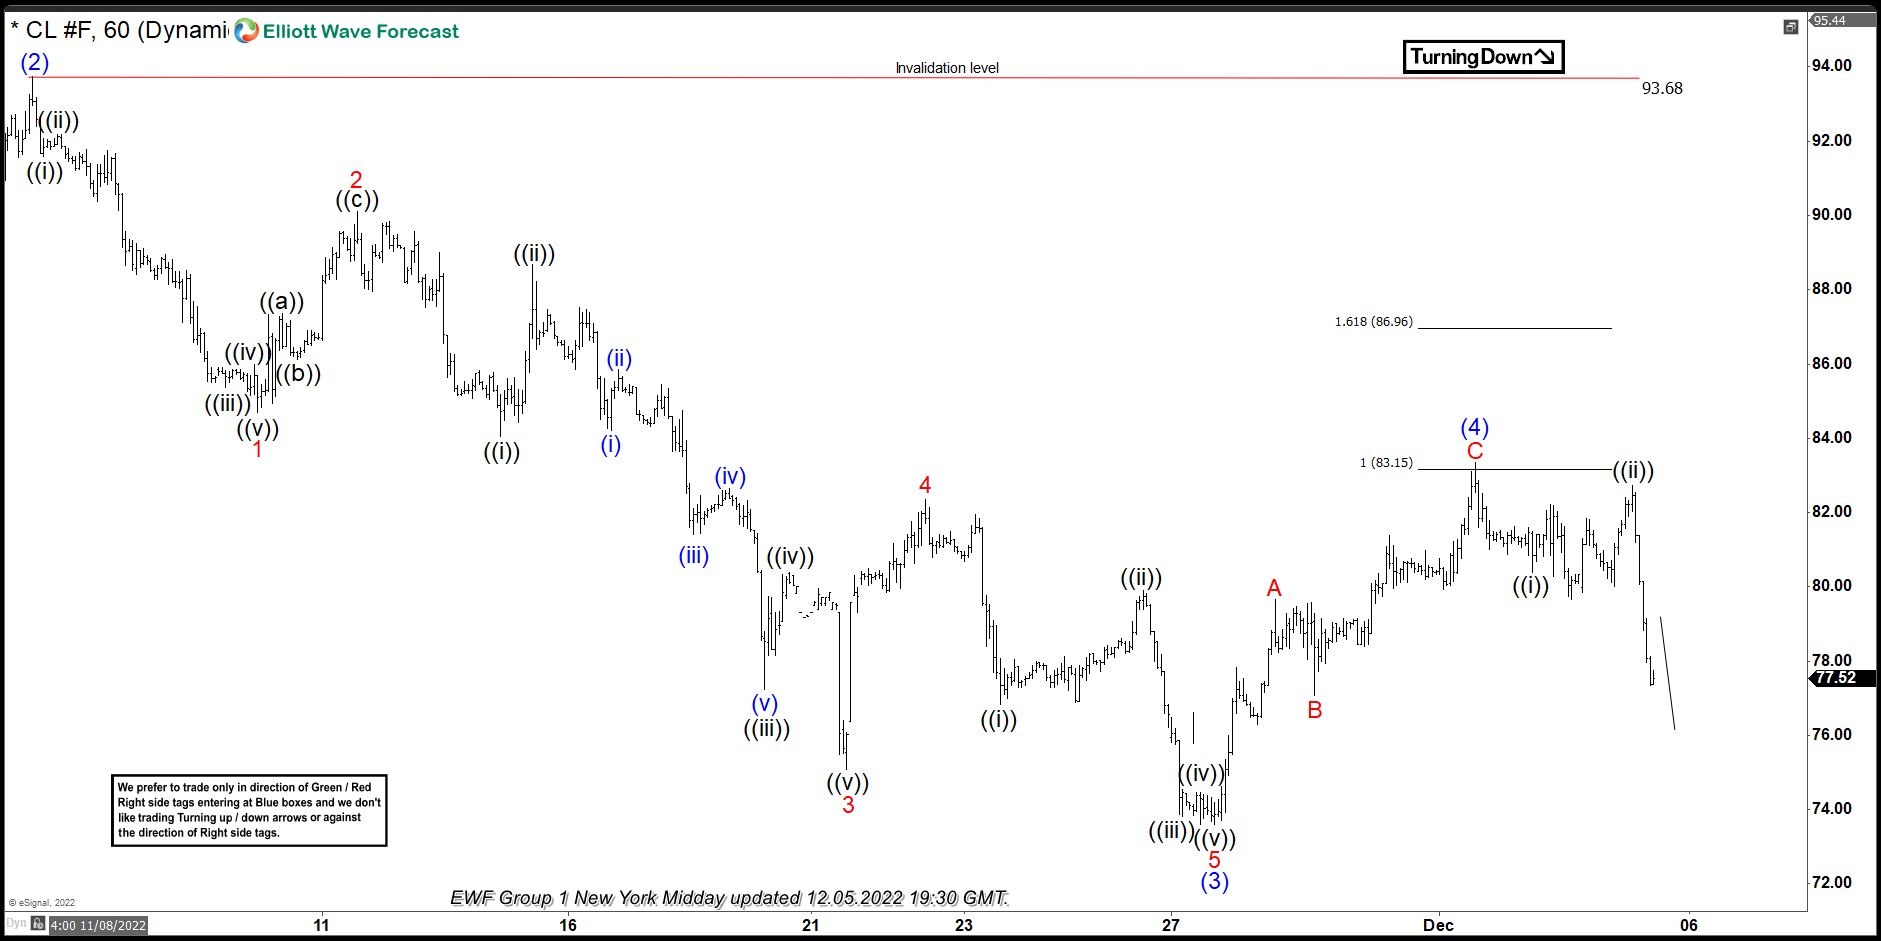
Sellers appeared right at the marked extreme zone : 83.18-86.98 area and we got good reaction. Current view suggests (4) blue completed at 83.39 high. While below that high, we expect further decline to resume toward 71.28-67.57 area ideally.
Keep in mind not every chart is trading recommendation. You can check most recent charts and new trading setups in the membership area of the site. Best instruments to trade are those having incomplete bullish or bearish swings sequences. We put them in Sequence Report and best among them are shown in the Live Trading Room.
Source: https://elliottwave-forecast.com/commodities/oil-cl_f-elliott-wave/