
The series of rate hikes by the Fed has provided a challenge for the World Indices. World Indices continue to make a series of lower low since they formed the peak in 2021. One of the popular vehicles to trade Indices is QQQ. Invesco QQQ is an exchange-traded fund (ETF) that tracks the Nasdaq-100 Index™. The Index includes the 100 largest non-financial companies listed on the Nasdaq based on market cap. Below we will take a look at the Daily Elliott Wave chart for QQQ which favors further downside overall.
QQQ Daily Elliott Wave Chart
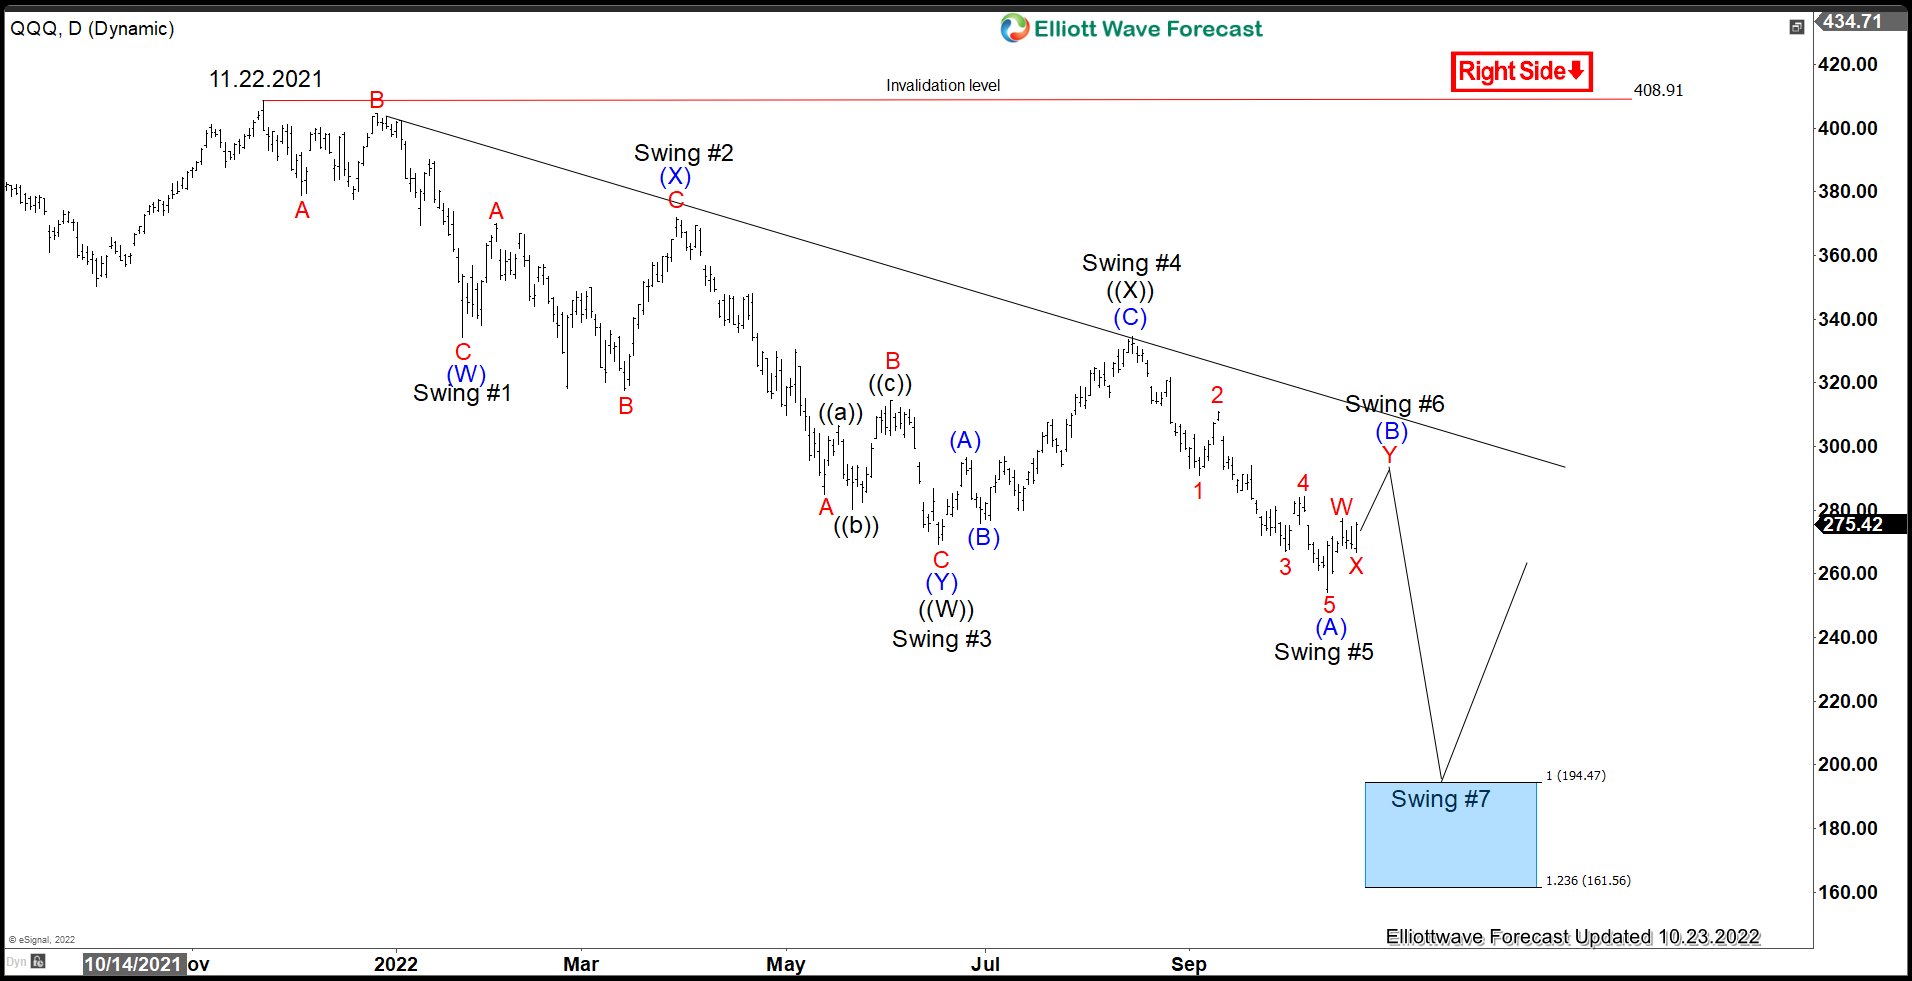
Daily Chart of QQQ (ETF tracking Nasdaq-100 Index) shows that it has a bearish sequence from 11.22.2021 high. Structure of the decline is in a double three Elliott Wave structure. Down from 11.22.2021 high, wave (W) ended at 334.15 and wave (X) rally ended at 371.83. The ETF then extended lower in wave (Y) towards 269.28 which also completed wave ((W)). Wave ((X)) rally ended at 334.42 and the ETF has resumed lower. Wave ((Y)) is now in progress and should reach 100% – 123.6% at 161 – 194 area before buyers appear for a new leg higher or 3 waves rally at least. We continue to prefer the long side in 3, 7, or 11 swing.
Source: https://elliottwave-forecast.com/stock-market/qqq-shows-bearish-sequence-from-2021-peak/