
Hello fellow traders. In this article we’re going to take a quick look at the Elliott Wave charts of $YM_F, published in members area of the website. As our members know INDU ended cycle from the 34288 high as 5 waves, and now correcting it. Recovery looks incomplete and we expect to see more short term strength. Recently INDU made a short term pull back that has reached its target area and found buyers as expected. In the further text we are going to explain the Elliott Wave Forecast.
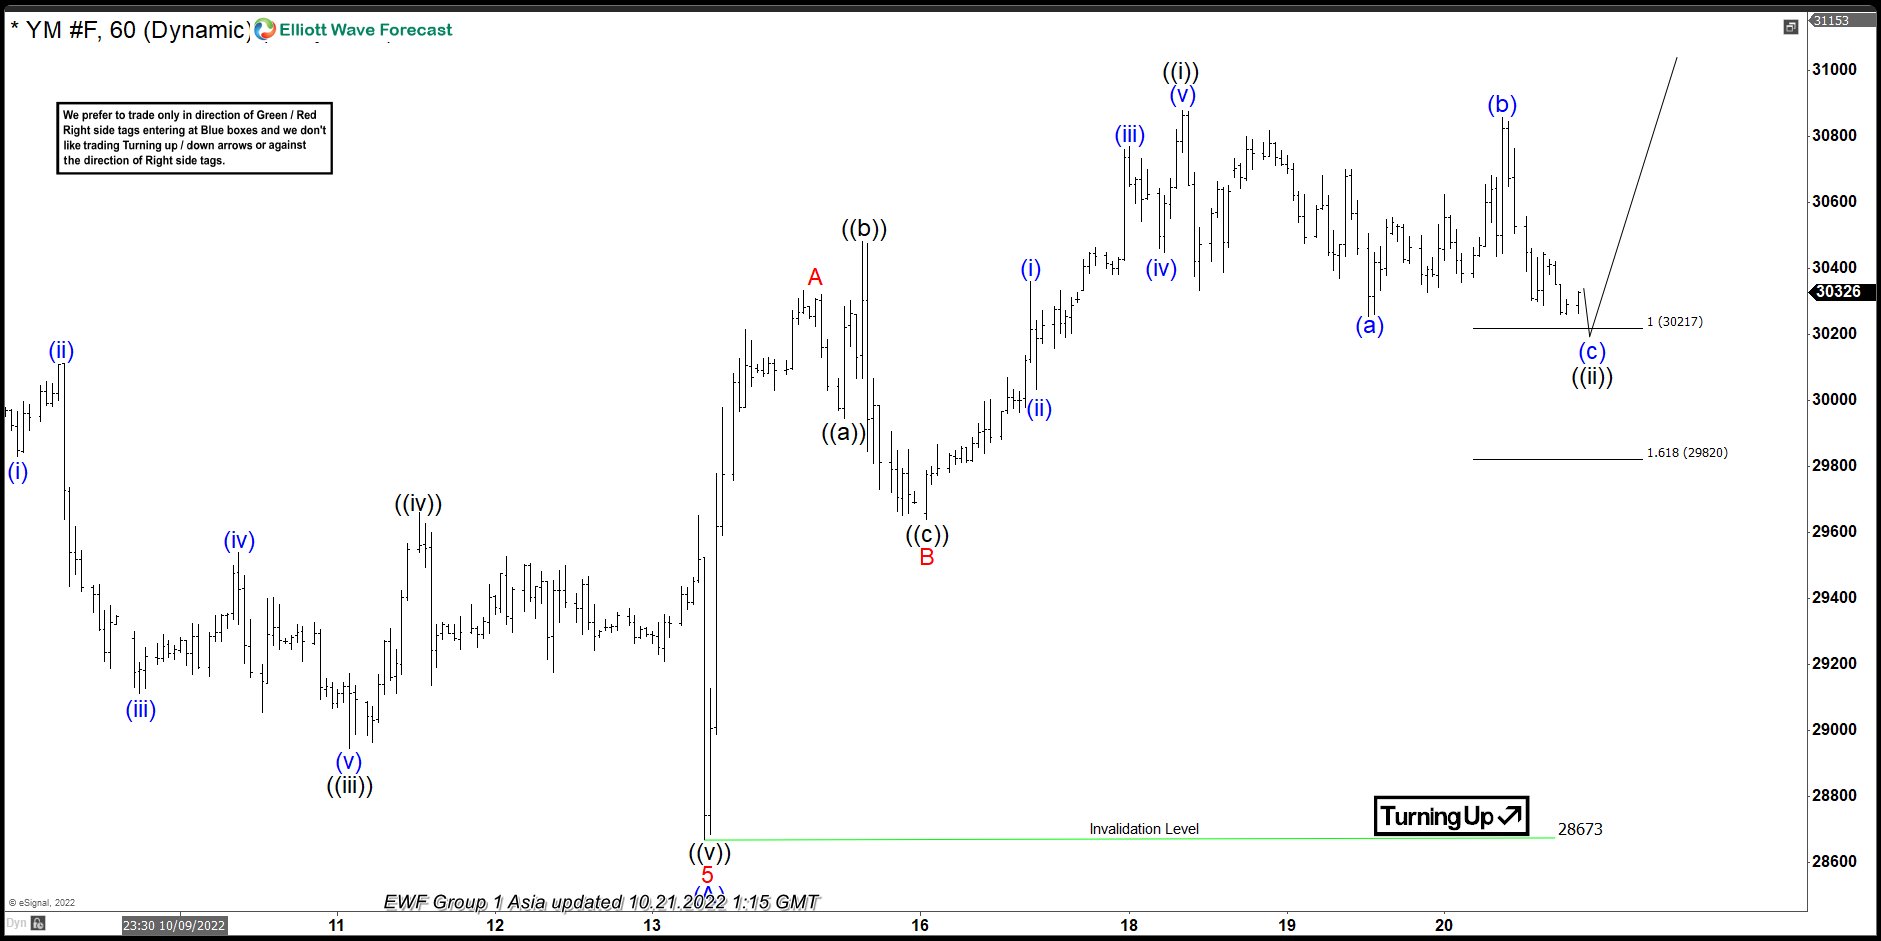
INDU Elliott Wave 1 Hour Chart 10.21.2022
Dow Jones Feature is giving us correction against the 34288 high, targeting 31458+ area. We are getting intraday ((ii)) black pull back that still looks incomplete at the moment. We expect to see more downside in near term toward 30217-29820 area. Buyers should ideally appear at the marked zone for the further rally toward new high ideally or for a 3 waves bounce at least.
You can learn more about Elliott Wave Patterns at our Free Elliott Wave Educational Web Page.
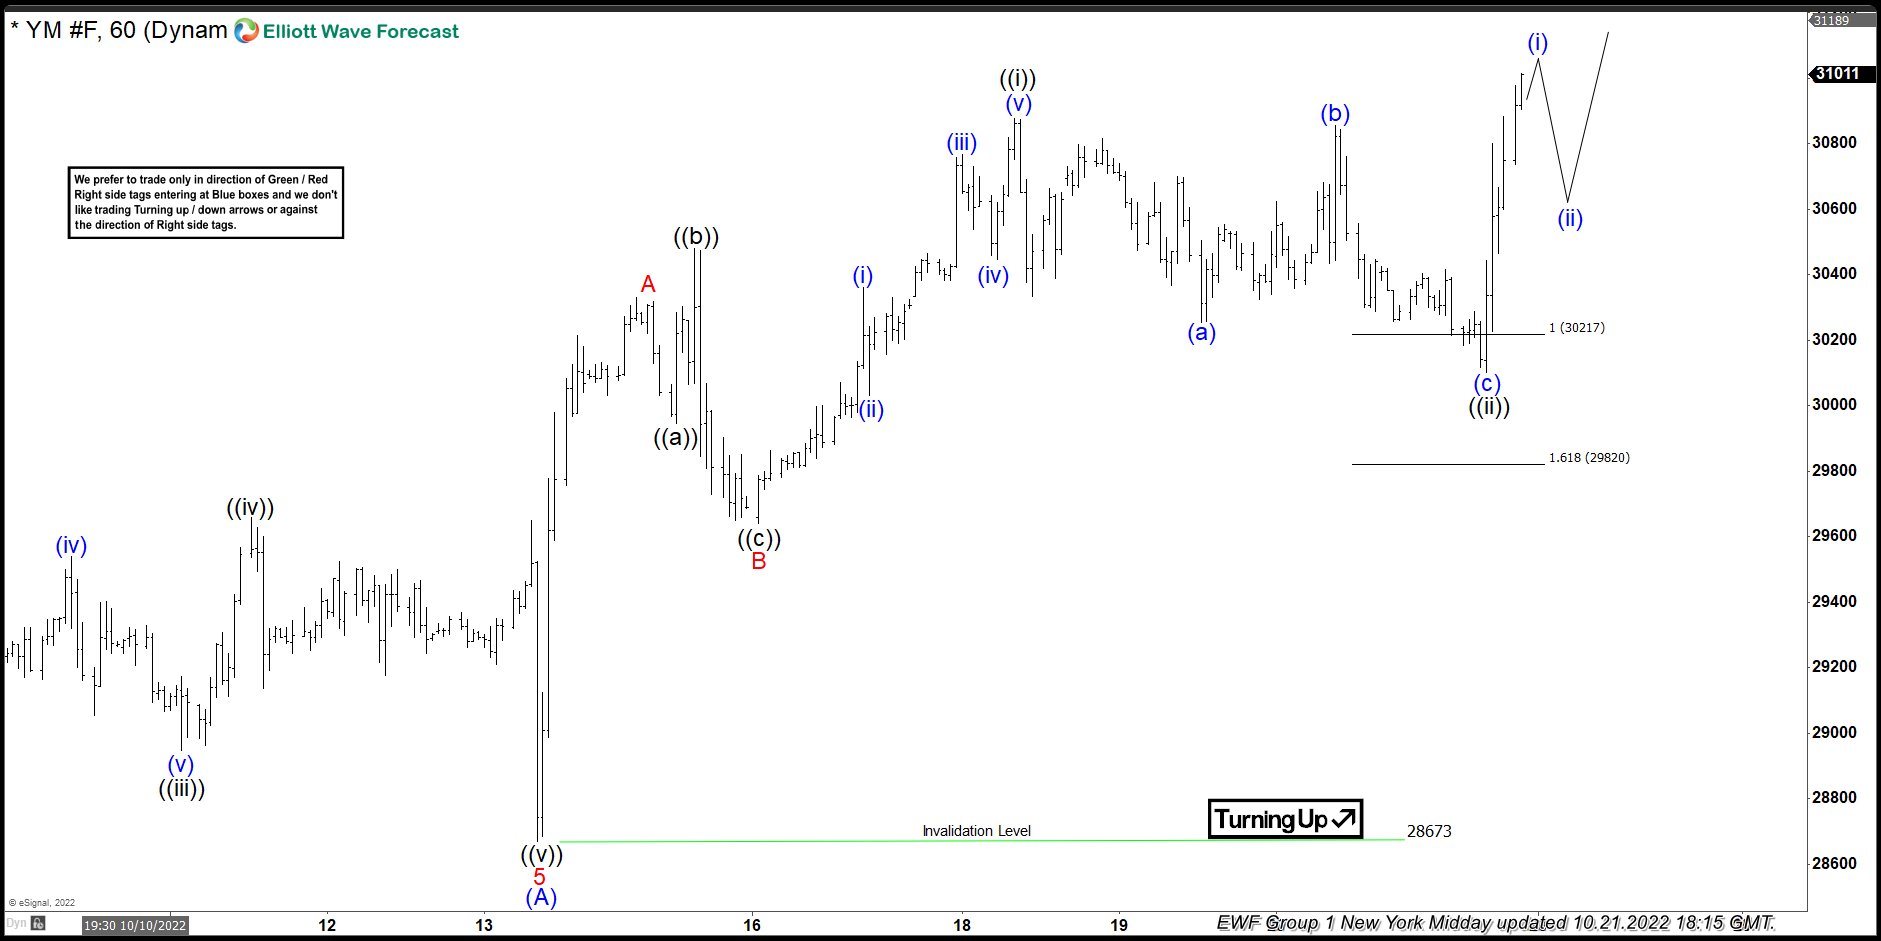
INDU Elliott Wave 1 Hour Chart 10.21.2022
Pull back reached our target zone at 30217-29820 area. INDU found buyers at the marked zone and we are getting good reaction from there. Rally from the buyers zone made break of previous peak confirming next leg is in progress. Wave ((ii)) is done and we should be ideally trading within wave ((iii). You can check most recent charts with target levels in the membership area of the site.Keep in mind that market is dynamic and presented view could have changed in the mean time. . Best instruments to trade are those having incomplete bullish or bearish swings sequences. We put them in Sequence Report and best among them are shown in the Live Trading Room
Source: https://elliottwave-forecast.com/stock-market/indu_-ym_f-_elliott-wave/