
Hello fellow traders. In this technical blog we’re going to take a quick look at the Elliott Wave charts of Soybeans Futures. As our members know, $ZS_F is having bearish sequences in the cycle from the June 1784’0 peak. Current view is calling for further weakness against the 1671’3 pivot. Recently the commodity has given us 3 waves correction against the mentioned peak. soybens futures found sellers right at equal legs area as we expected. In the further text we are going to explain the Elliott Wave Forecast and trading strategy.
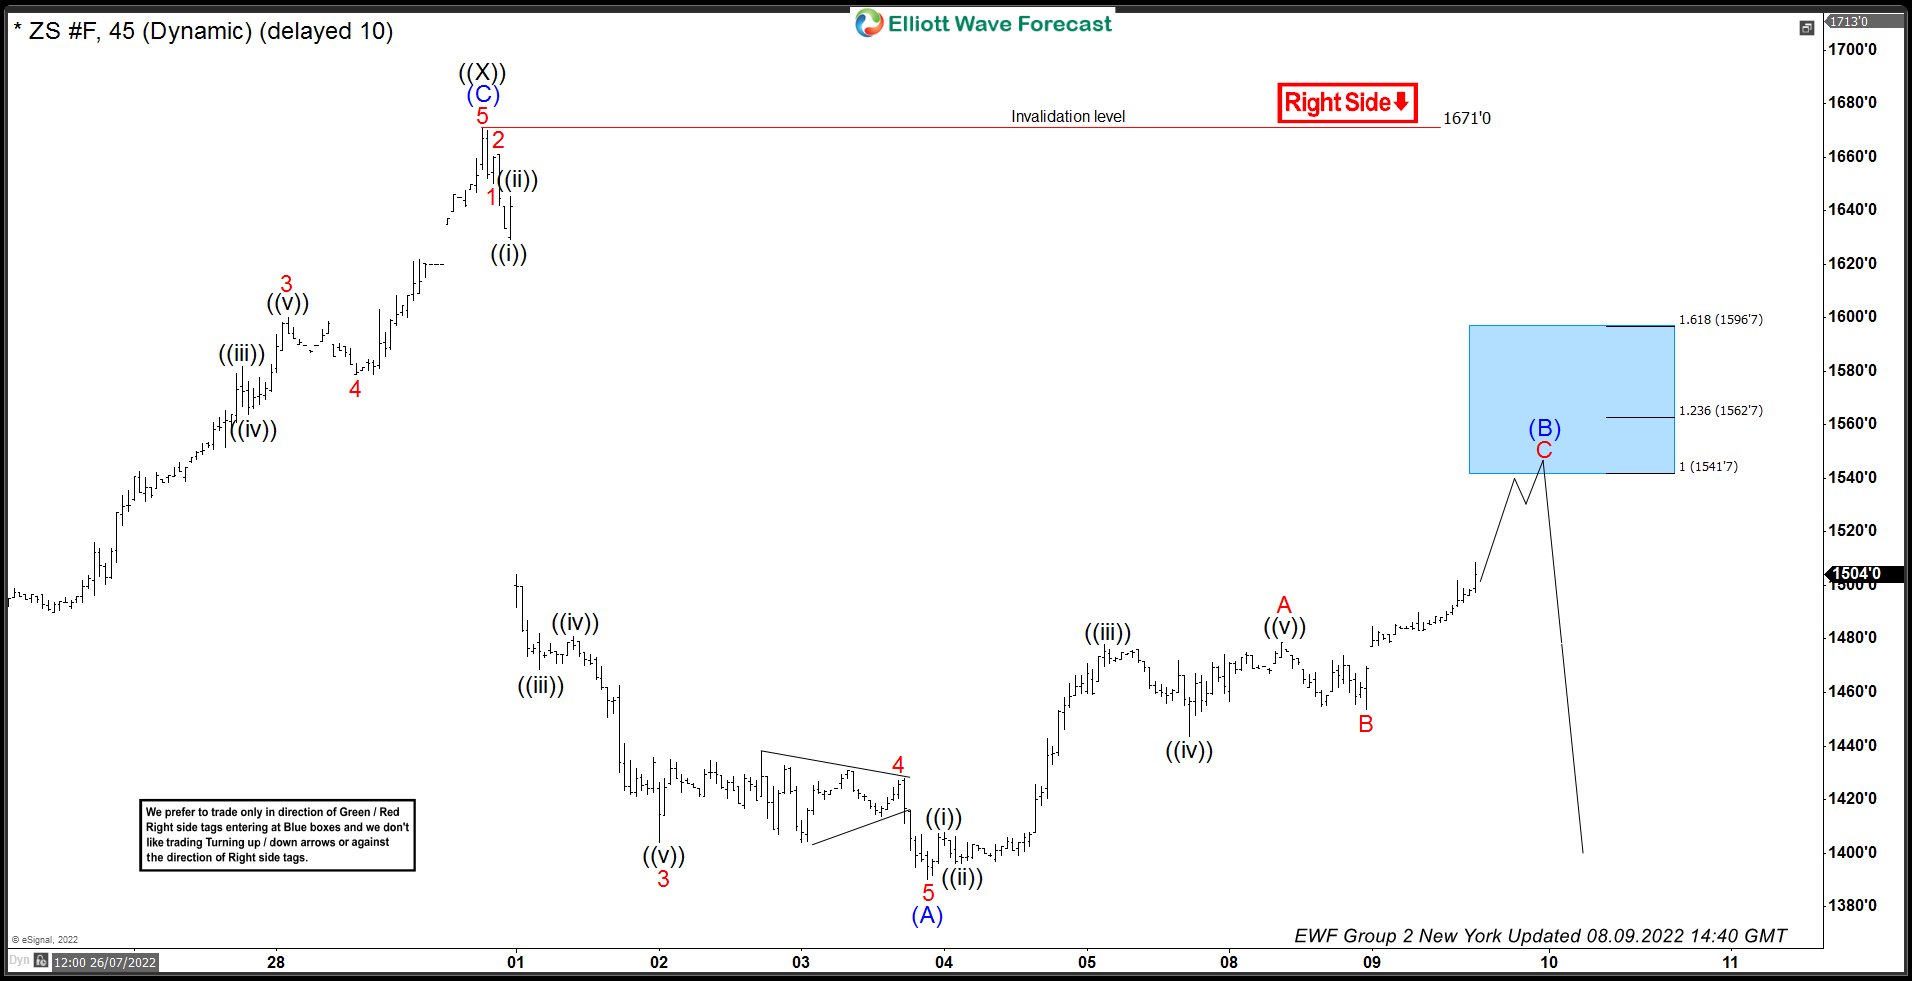
Soybeans H1 Elliott Wave Analysis 08.09.2022
Soybeans is correcting the short term cycle from the 1681’0 peak. Recovery seems to be unfolding as Elliott Wave Zig Zag which looks incomplete at the moment. The price structure suggests more upside toward 1541’7-1596’7 area, blue box- selling zone. As the commodity is currently in bearish cycle, we expect sellers to appear at the marked zone for further decline toward new lows or for a 3 waves pull back at least . Strategy is selling the commodity at the marked zone. Invalidation for the trade would be break above 1.618 fibs extension: 1596’7. As the main trend is bearish we expect sellers to appear at the blue box for 3 waves pull back at least. Once pull back reaches 50 Fibs against the B red low, we will make short position risk free ( put SL at BE) and take partial profits.
Reminder: You can learn about Elliott Wave Rules and Patterns at our Free Elliott Wave Educational Web Page.
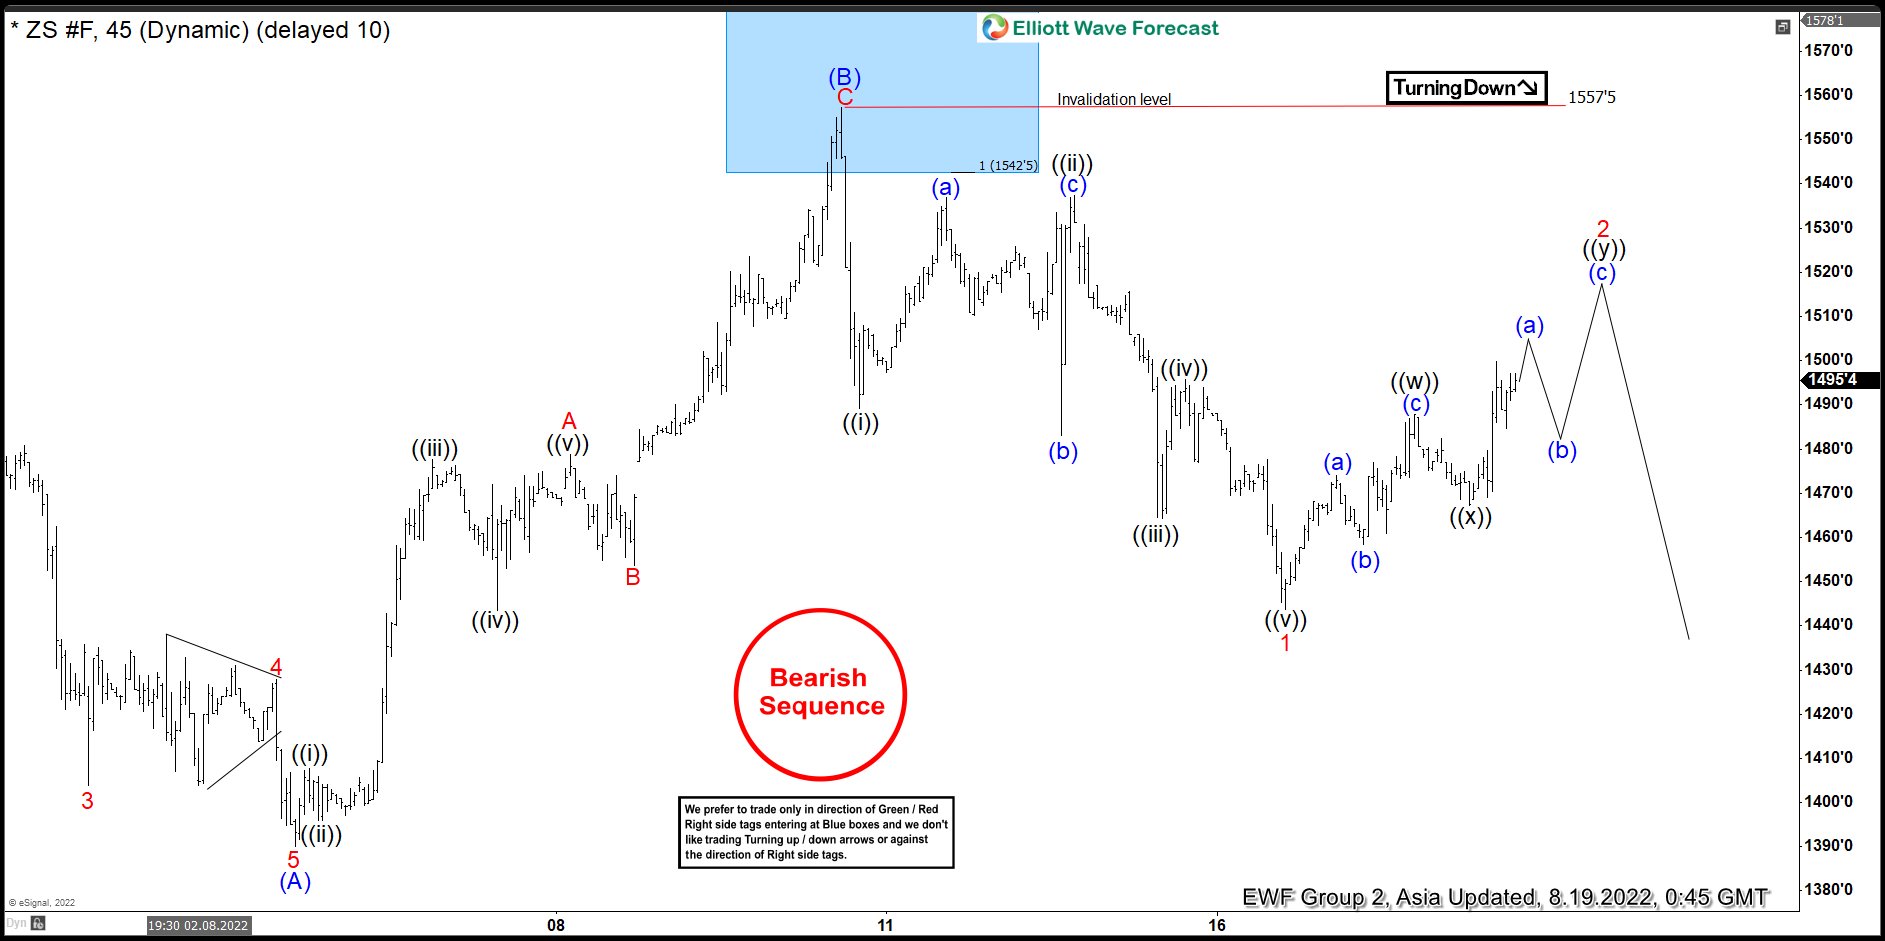
Soybeans H1 Elliott Wave Analysis 08.19.2022
Eventually , soybeans made extension higher toward our selling zone :1541’7-1596’7. The commodity found sellers right at the blue box and made decent reaction lower from there. As a result, members who took short trades at the blue box got opportunity to make positions risk free ( Put SL at BE) and take partial profits. At this stage we see wave (B) blue recovery completed at 1557’5 high. Decline from the mentioned peak looks as 5 waves structure which increase chances of further extension down. We would like to see break of previous low : (A) blue to confirm next leg down is in progress.
Keep in mind market is dynamic and presented view could have changed in the mean time. You can check most recent charts in the membership area of the site. Best instruments to trade are those having incomplete bullish or bearish swings sequences.We put them in Sequence Report and best among them are shown in the Live Trading Room.
Elliott Wave Forecast
Source: https://elliottwave-forecast.com/trading/soybeans-zs_f-selling-blue-box/