Good day Traders and Investors. In today’s article, we are going to take a look at the Elliott Wave path in Uber Technologies Inc. ($UBER).
Uber Technologies, Inc. ($UBER) is an American mobility service provider, allowing users to book a car and driver to transport them in a way similar to a taxi. It is based in San Francisco with operations in approximately 72 countries and 10,500 cities in 2021. Its services include ride-hailing, food delivery (Uber Eats), package delivery, couriers, freight transportation, electric bicycle and motorized scooter rental via a partnership with Lime. Uber does not own any vehicles, but receives a commission from each booking. Fares, which vary using a dynamic pricing model based on local supply and demand at the time of the booking, are quoted to the customer in advance.
Uber Elliottwave latest view (Daily):
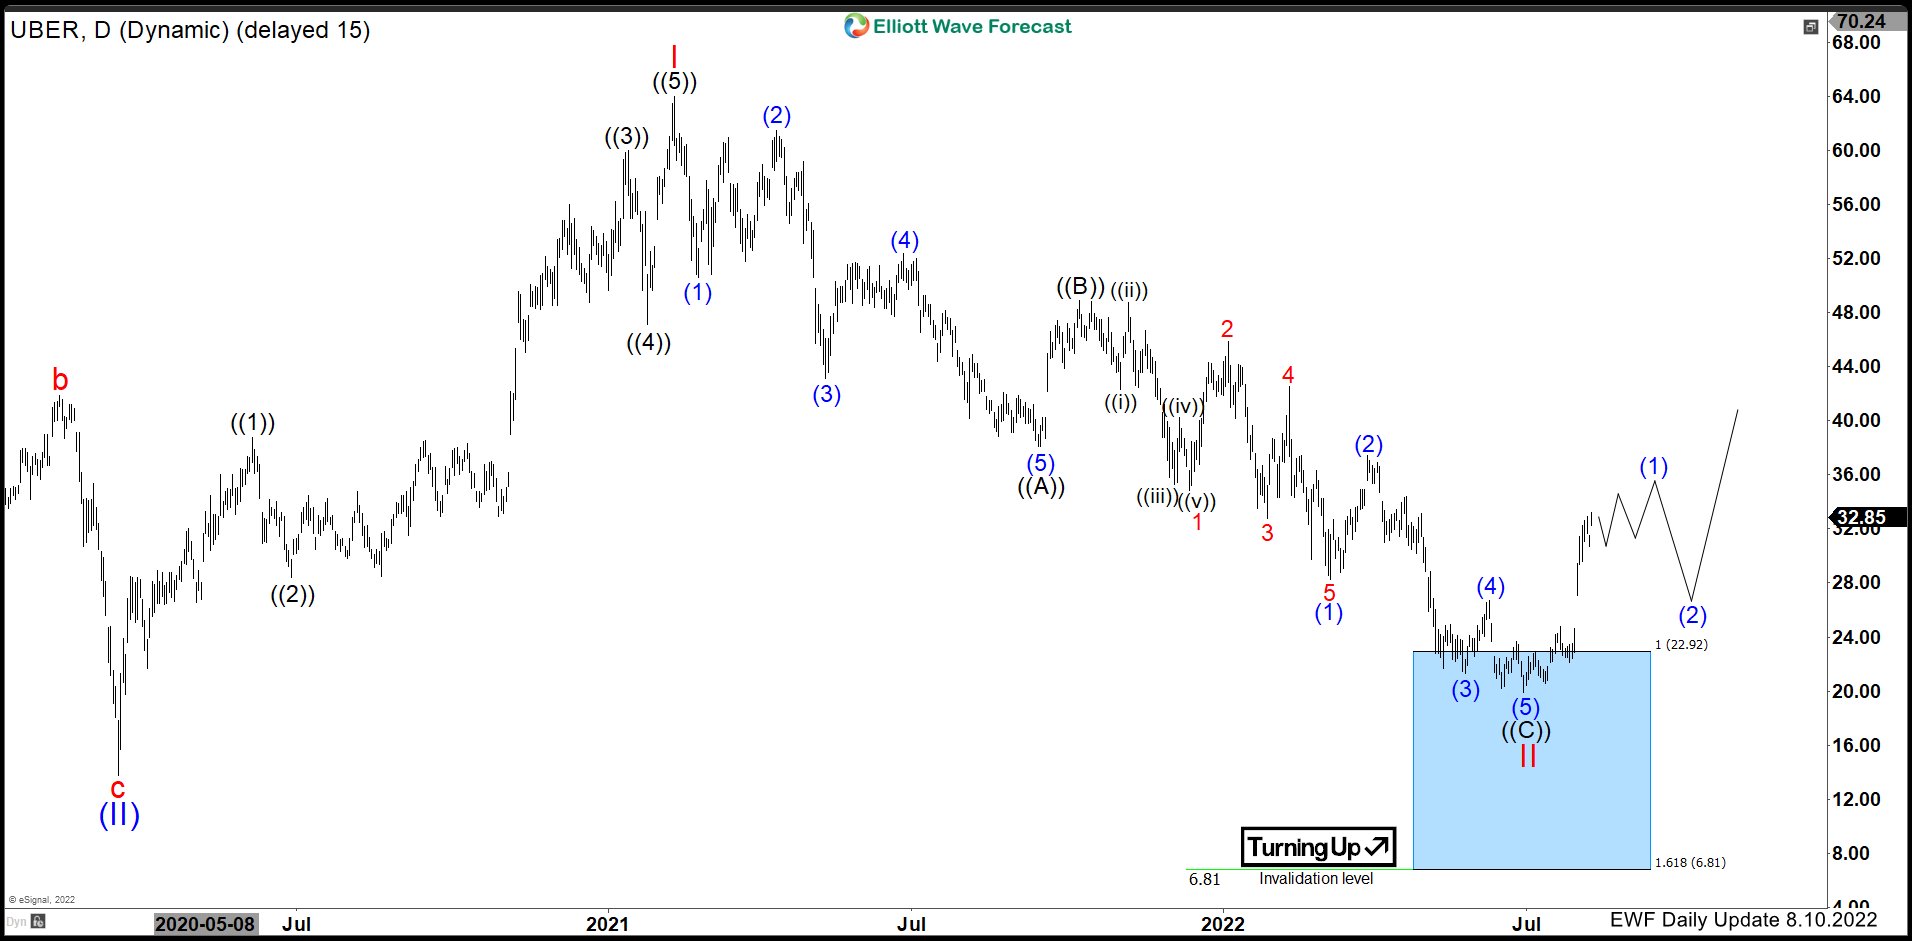
The Daily Chart above shows the cycle from March 2020 low unfold in a 5 waves structure. It peaked on February 2021 at $64.05 and started the decline to correct against March 2020 low. The decline so far has unfolded in an ABC structure showing 5 swings in ((A)). The bounce then broke above the RSI channel favouring it to be the connector in ((B)). The stock then extended the decline in ((C)) in another 5 swings to reach the Blue box extreme area at $22.92 – $6.81 where buyers appeared and started a bounce higher. The cycle from the peak has ended. Momentum has been strong since the bounce breaking RSI channel on the Daily. As long as price remains above 06/30/2022 low at $19.90 the low can be in and the stock is favoured to keep extending higher.