
Hello fellow traders. In this technical blog we’re going to take a quick look at the Elliott Wave charts of Palladium ( $PA_F ) . As our members know, Palladium is showing incomplete bearish sequences in the cycle from the March peak (3425). Recently the commodity has given us 3 waves bounce against the 2354 high . Recovery unfolded as Elliott Wave Zig Zag pattern . Once the price made 5 waves up in ((C)) leg sellers appeared so we got the expected turn lower. In the further text we are going to explain the Elliott Wave Pattern and the Forecast.
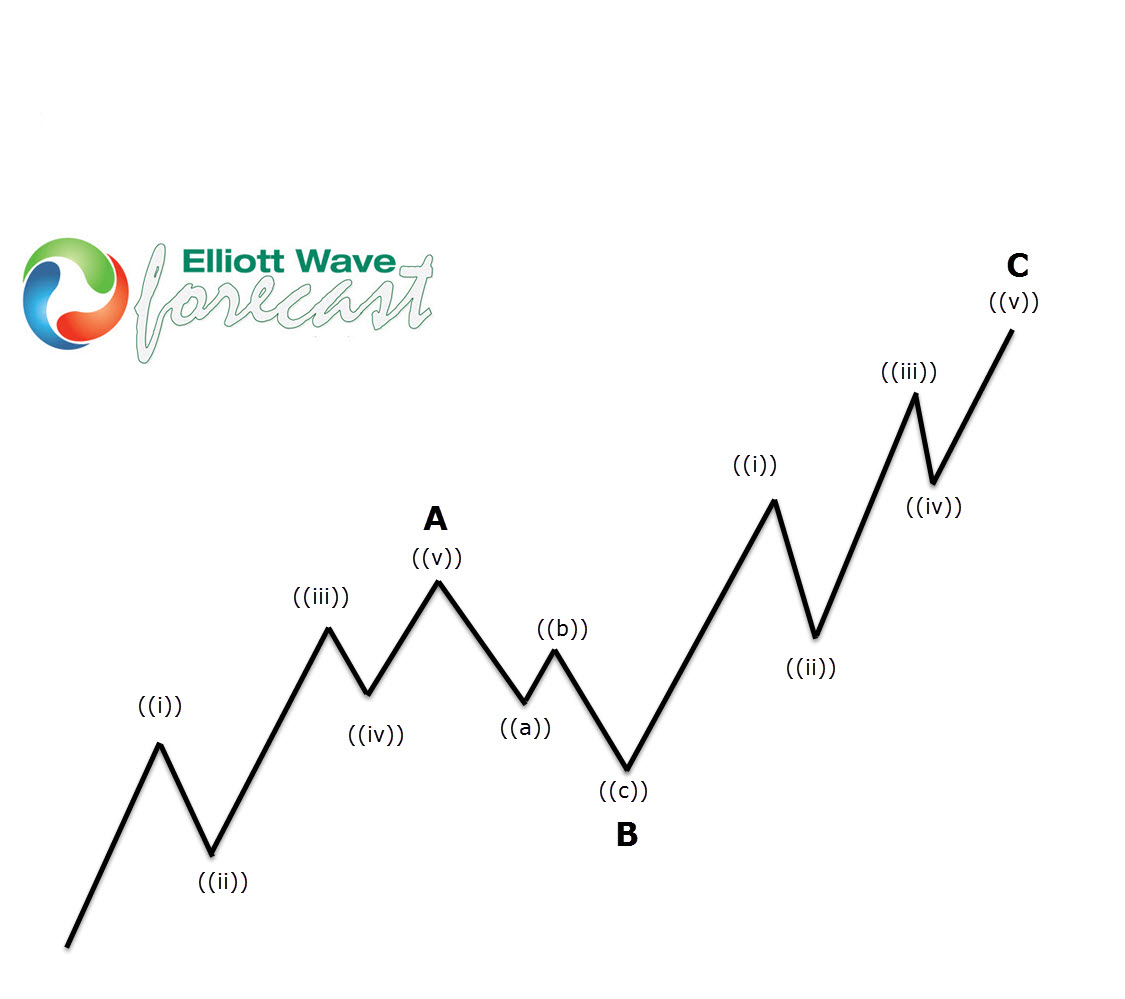
Before we take a look at the real market example, let’s explain Elliott Wave Zigzag pattern.
Elliott Wave Zigzag is the most popular corrective pattern in Elliott Wave theory . It’s made of 3 swings which have 5-3-5 inner structure. Inner swings are labeled as A,B,C where A =5 waves, B=3 waves and C=5 waves. That means A and C can be either impulsive waves or diagonals. (Leading Diagonal in case of wave A or Ending in case of wave C) . Waves A and C must meet all conditions of being 5 wave structure, such as: having RSI divergency between wave subdivisions, ideal Fibonacci extensions and ideal retracements.
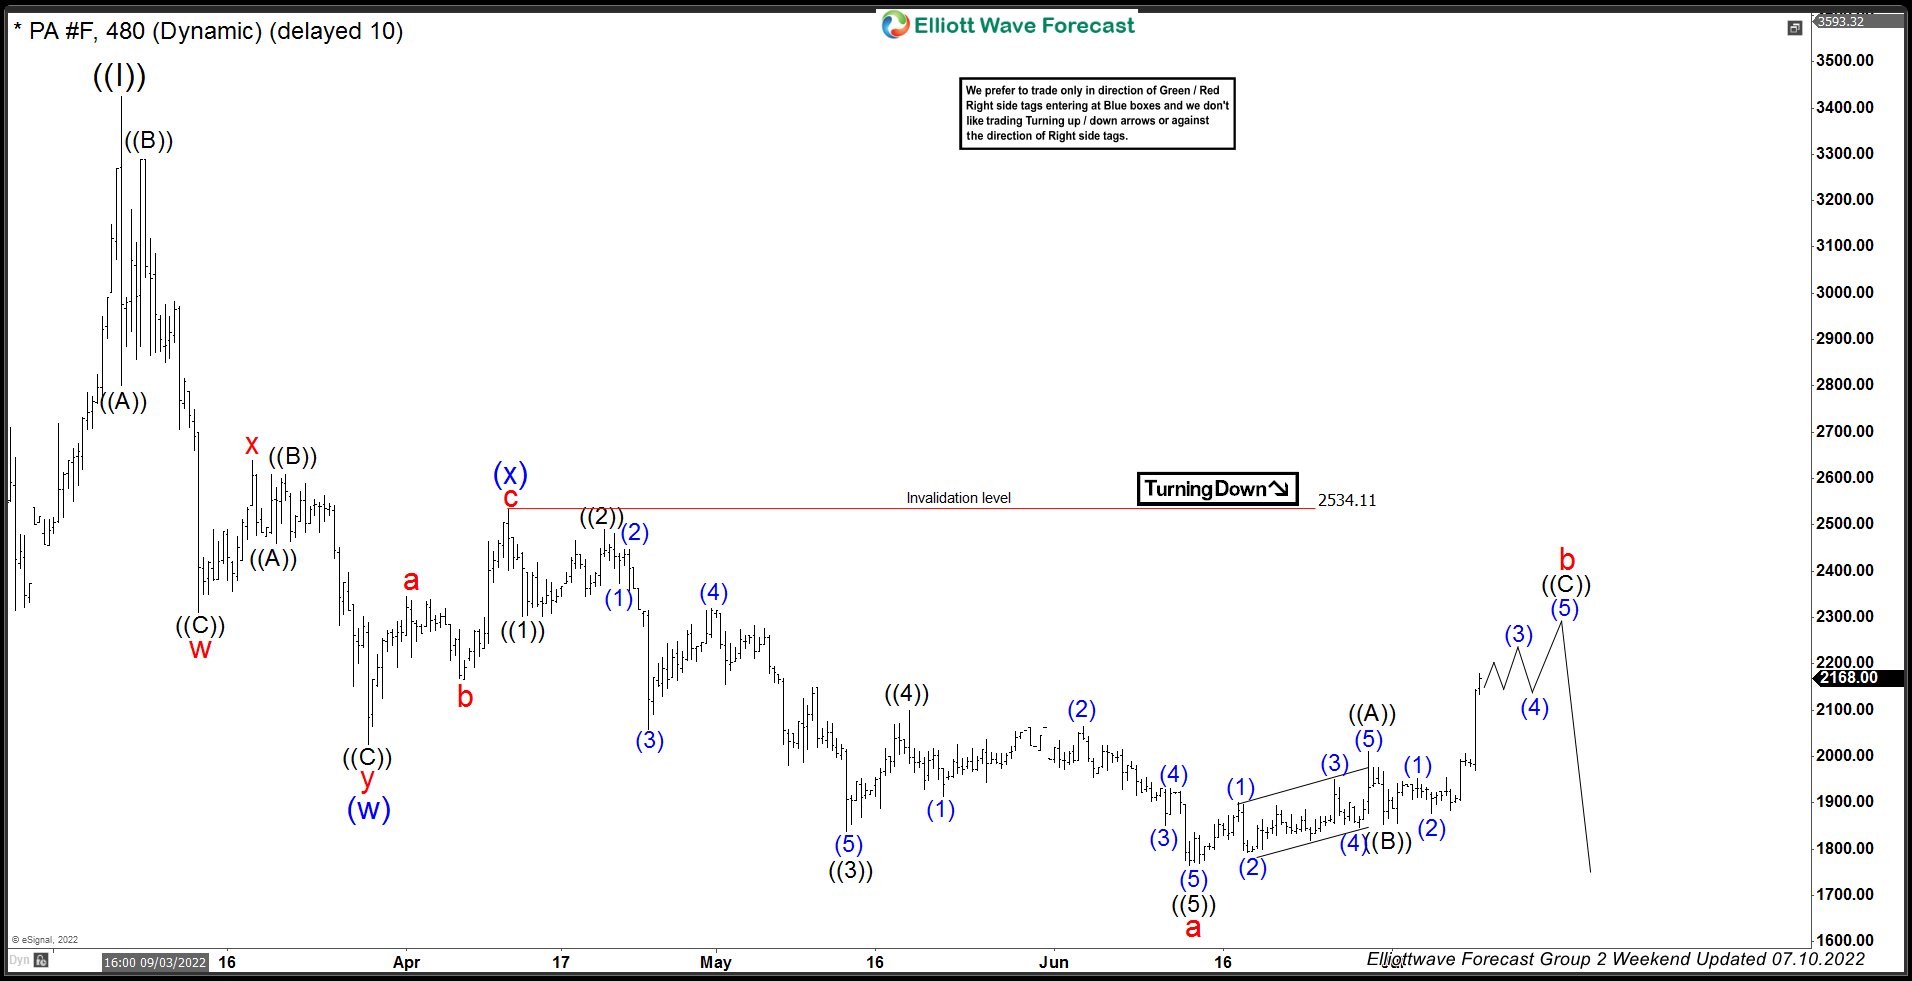
Palladium H4 Elliott Wave Analysis 07.10.2022
Palladium features is correcting the cycle from the 2534.1 peak. Recovery looks incomplete at the moment. We got 5 waves up in the first leg ((A))- leading diagonal, which suggests we are doing Elliott Wave Zig Zag Pattern . Consequently we expect to see 5 waves up in the ((C)) leg as well. For now ((C)) leg shows only 3 waves, so we expect pull back in (4) and last push up in (5). Approximate area where b red correction can complete is equal legs from the lows at 2093-2239.We don’t recommend buying the commodity and favor the short side due to incomplete sequences.
You can learn more about Zig Zag Elliott Wave Patterns at our Free Elliott Wave Educational Web Page.
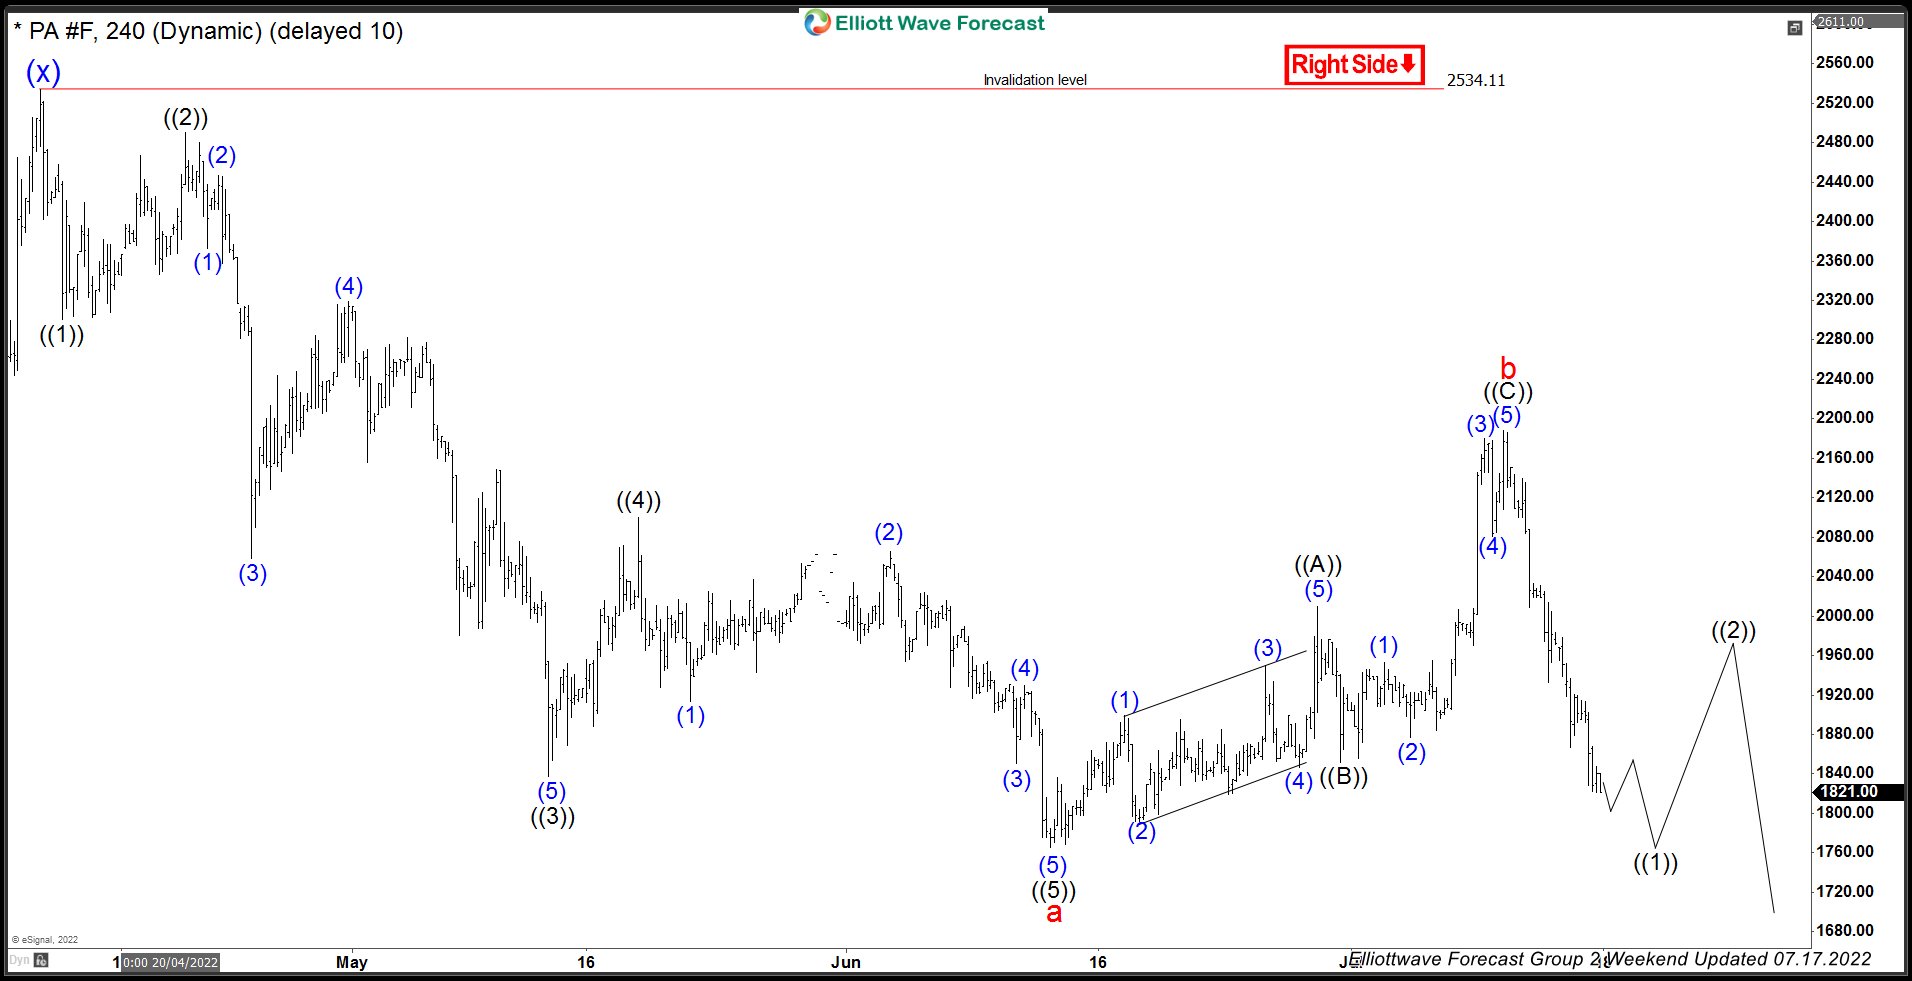
Palladium H4 Elliott Wave Analysis 07.17.2022
The price made 5 waves up in ((C)) wave and find sellers at the extreme zone 2093-2239 as expected. We got nice decline from there. Wave b red correction ended at 2188 peak. Now we would like to see further extension down and break below a red low – 06/13 low which would be confirmation wave c red is in progress.
Keep in mind market is dynamic and presented view could have changed in the mean time. You can check most recent charts in the membership area of the site. Best instruments to trade are those having incomplete bullish or bearish swings sequences.We put them in Sequence Report and best among them are shown in the Live Trading Room.
Elliott Wave Forecast
Source: https://elliottwave-forecast.com/elliottwave/palladium-pa_f-elliott-wave-zig-zag/