
Sony Group Corporation, commonly known as Sony and stylized as SONY, is a Japanese multinational conglomerate corporation headquartered in Kōnan, Minato, Tokyo, Japan. As a major technology company, it operates as one of the world’s largest manufacturers of consumer and professional electronic products, the largest video game console company and the largest video game publisher. Through Sony Entertainment Inc, it is one of the largest music companies (largest music publisher & second largest record label) and the third largest film studio, making it one of the most comprehensive media companies. It is the largest technology and media conglomerate in Japan. It is also recognized as the most cash-rich Japanese company, with net cash reserves of ¥2 trillion.
SONY Weekly Chart July 8th 2022
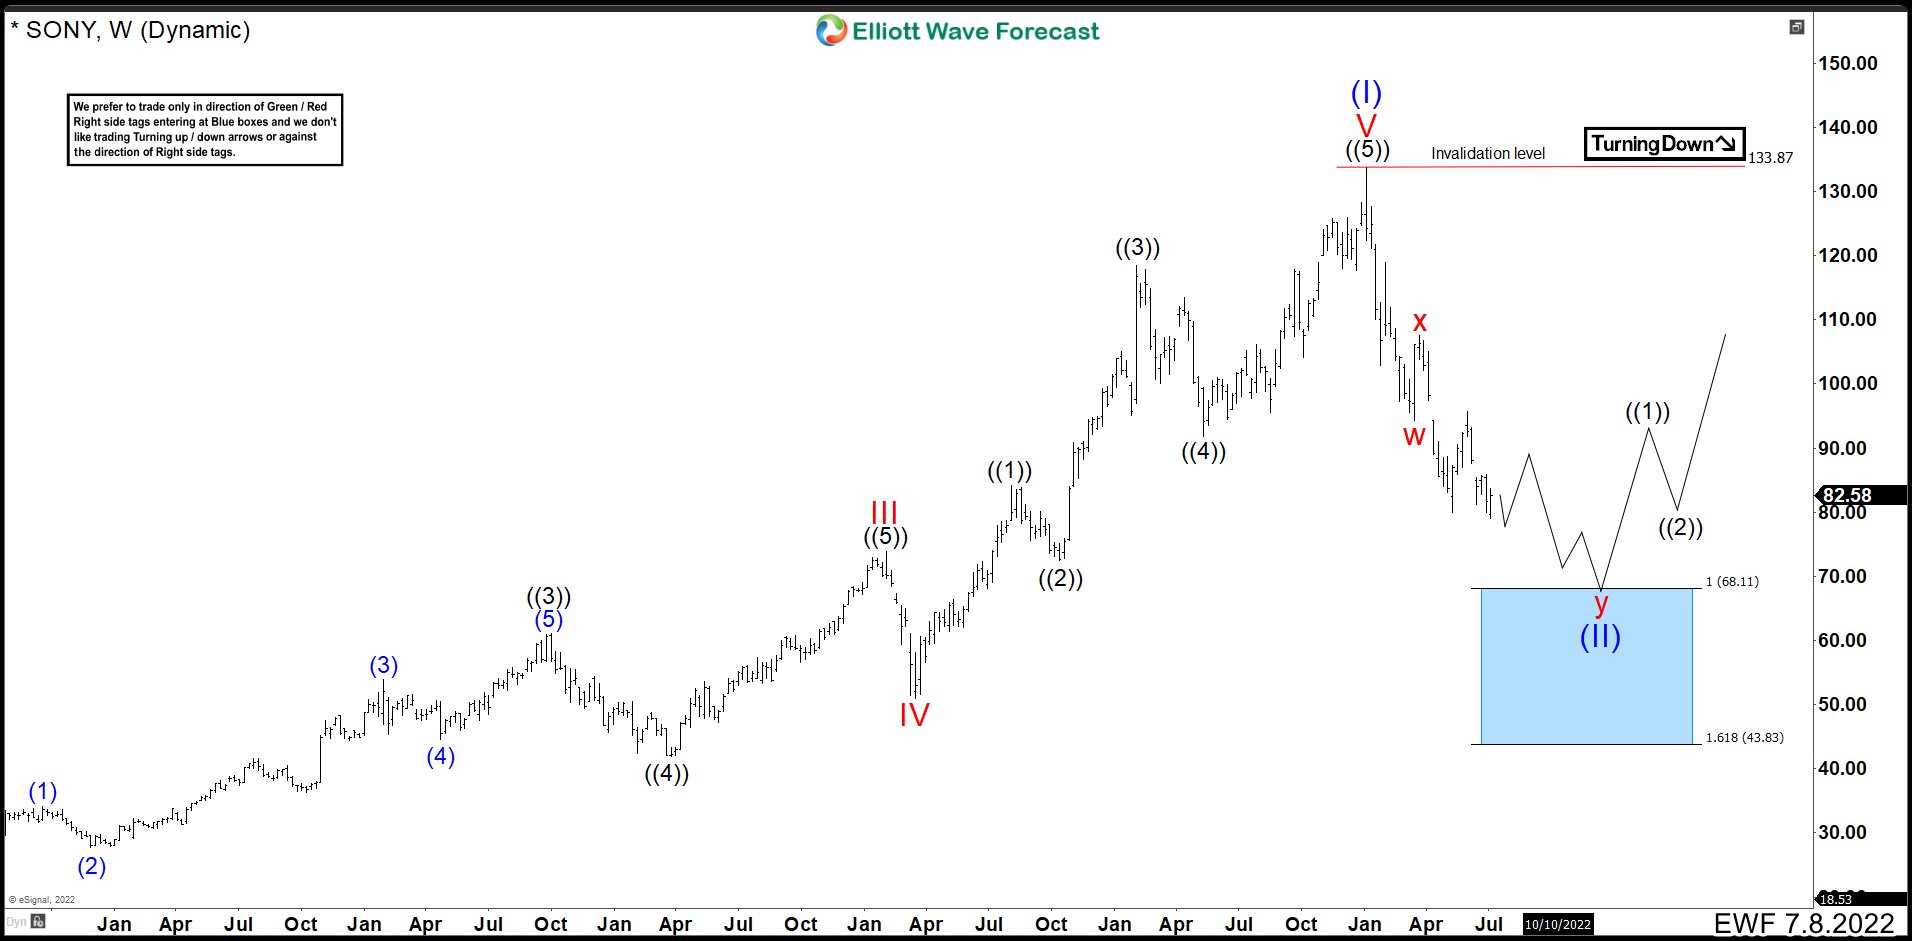
SONY completed an impulse that began at the end of 2012. The share price reached 133.75 in January 2021, that is, 9 years of upward movement. We have called this impulse wave (I). From here the price started to fall and we can see that 6 swings have been formed. This means the bearish sequence is incomplete because we need 7 swings to complete a double correction. This double correction would end the 2012 cycle pullback and then continue rally again. The first 3 swings formed the wave w at 94.33. Then we had a bounce that ended at 107.52 as wave x and this would be the fourth swing. From 107.52, we need 3 more swings to complete the double correction. Swings 5 and 6 are now ended, and we’re on the last one that should build an impulse. This would take us to the blue box 68.11 – 43.83 area. This would end wave y, wave (II), and the double correction whereby the market should continue higher.
SONY Weekly Chart July 8th 2022
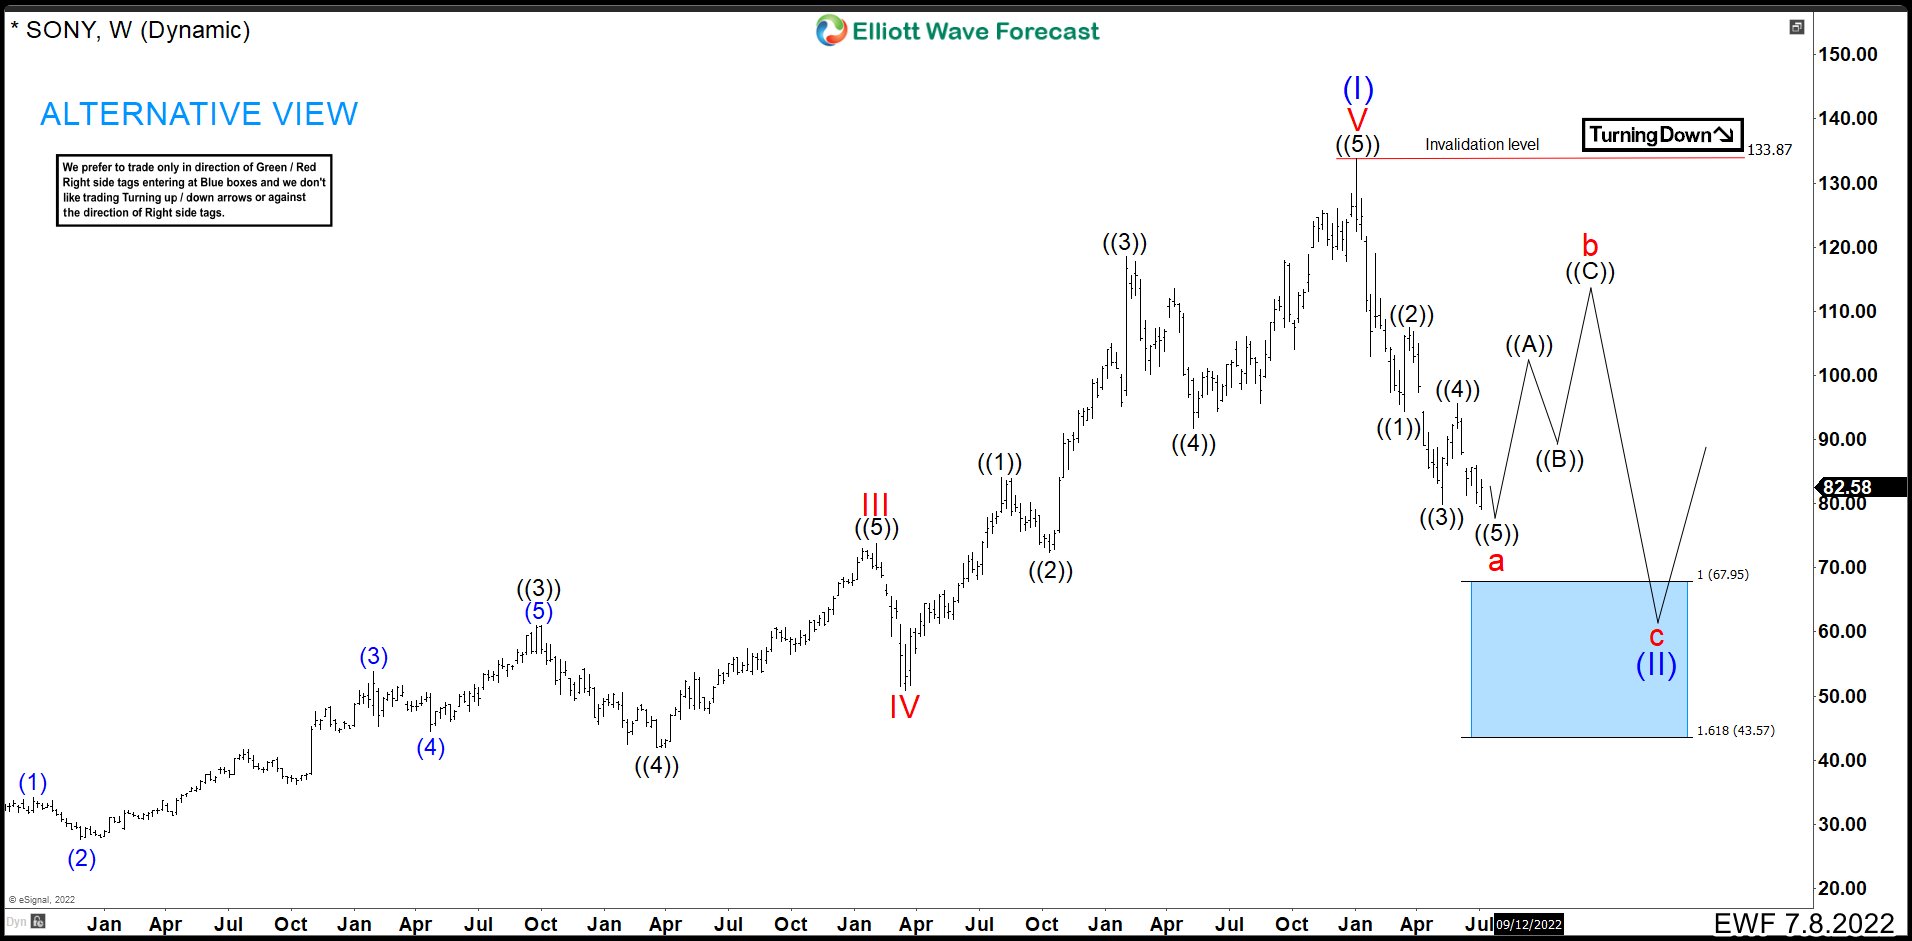
As an alternative count, we are running a leading diagonal from the 133.75 peak. (If you want to learn more about Elliott Wave Theory, please follow these links: Elliott Wave Education and Elliott Wave Theory). This would be close to end to complete wave a. From here, we should see a bounce higher in 3 waves to finish wave b first. Then the market would turn down in the form of an impulse to look for the blue box. Once the blue box is reached, we would complete wave c and the zigzag correction as wave (II). From here, we would look to continue the rally and break the 133.75 peak.
In conclusion, the key would be the break of 95.70. If we break this level, we would be developing the alternative count, if not the main count.
Source: https://elliottwave-forecast.com/stock-market/sony-further-bearish-in-this-year/