The Fed’s aggressive rate hikes to fight inflation has caused deterioration in economic outlook. Atlanta Fed’s GDP gauge now sees the second quarter running at – 2.1%. With the first quarter’s decline of 1.6%, this makes it two quarters in a row with negative GDP. This fits with the technical definition of a recession. As a result of the aggressive rate hikes, all risk assets including stock, commodities, and cryptos have been hit really hard while US Dollar has rallied very strongly. In today’s update, we will look specifically at Platinum to see a possible support area.
Platinum Monthly Elliott Wave Chart
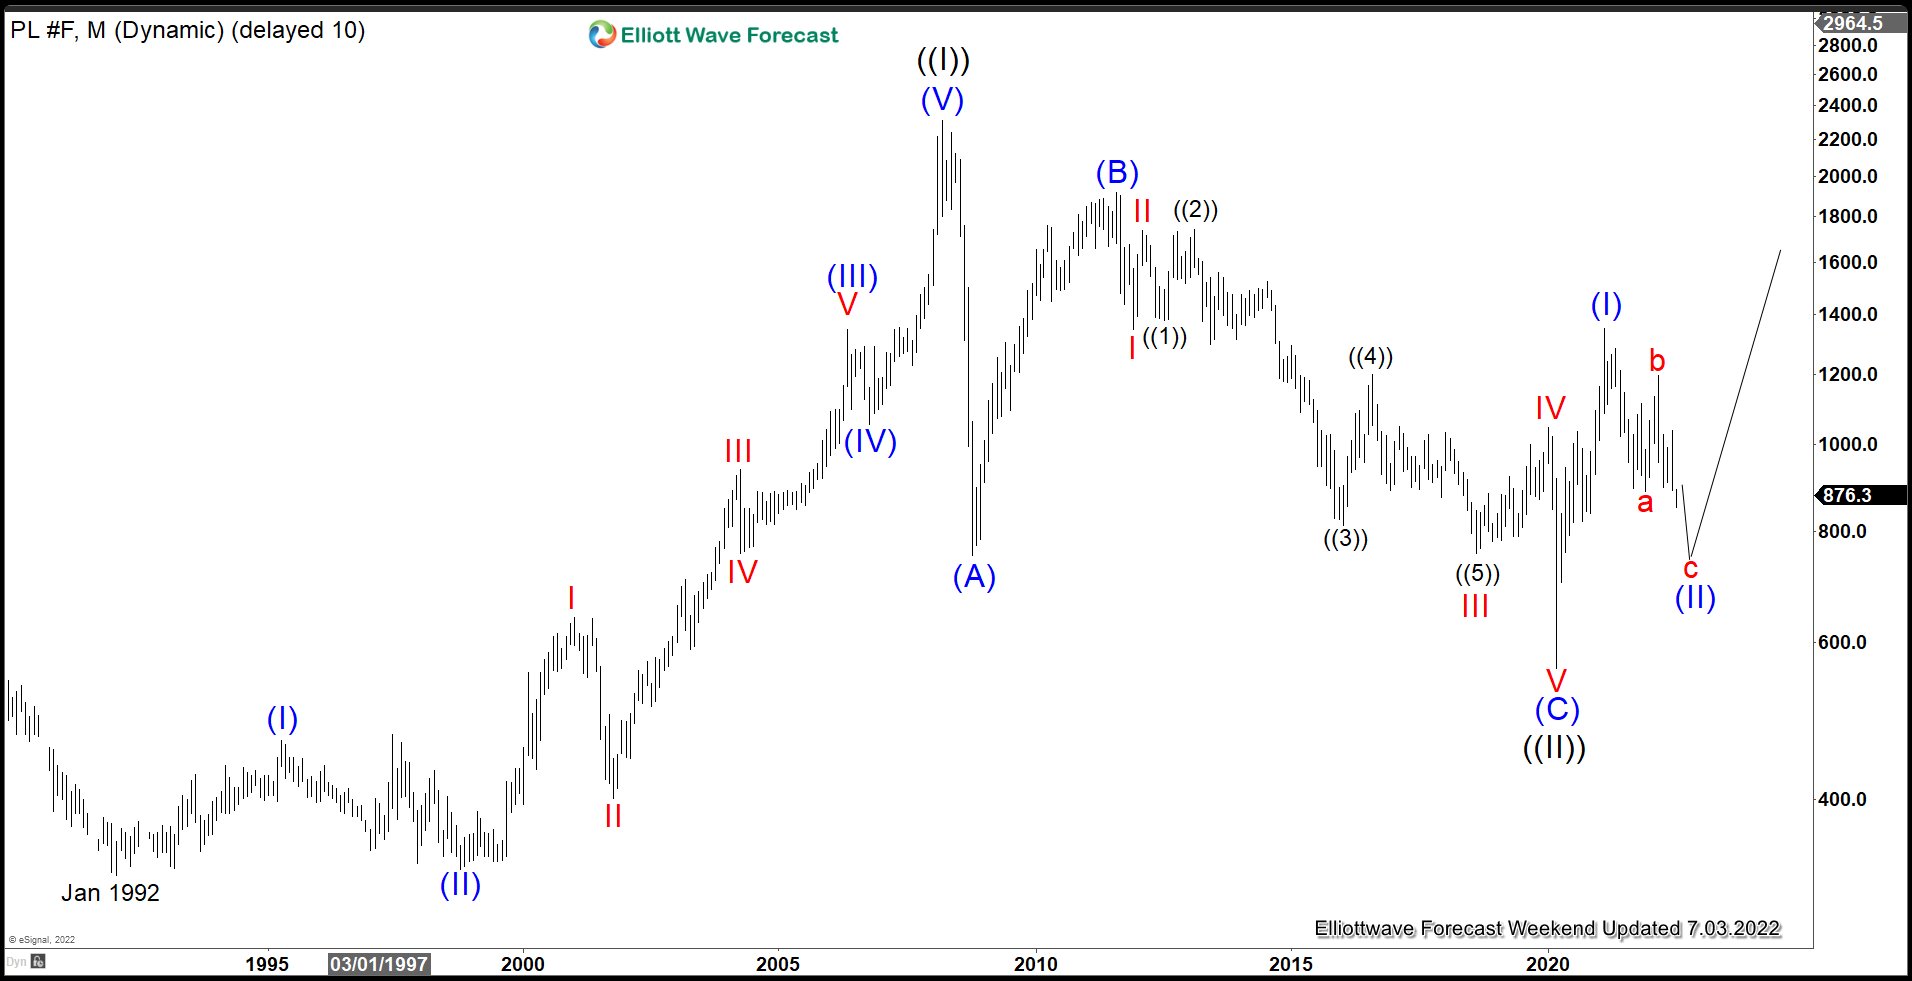
Monthly Elliott Wave in Platinum above suggests that the metal has ended Grand Super Cycle wave ((II)) pullback at $562. This ended the multi-decade correction to the cycle from January 1992. From there, Platinum has started a new bullish leg higher in wave ((III)). Up from wave ((II)), wave (I) ended at $1348.2. Wave ((II)) pullback is now in progress to correct cycle from 3/16/2020 low before the next leg higher. Let’s look at the daily chart below to get better look of the potential support area.
Platinum Daily Elliott Wave Chart
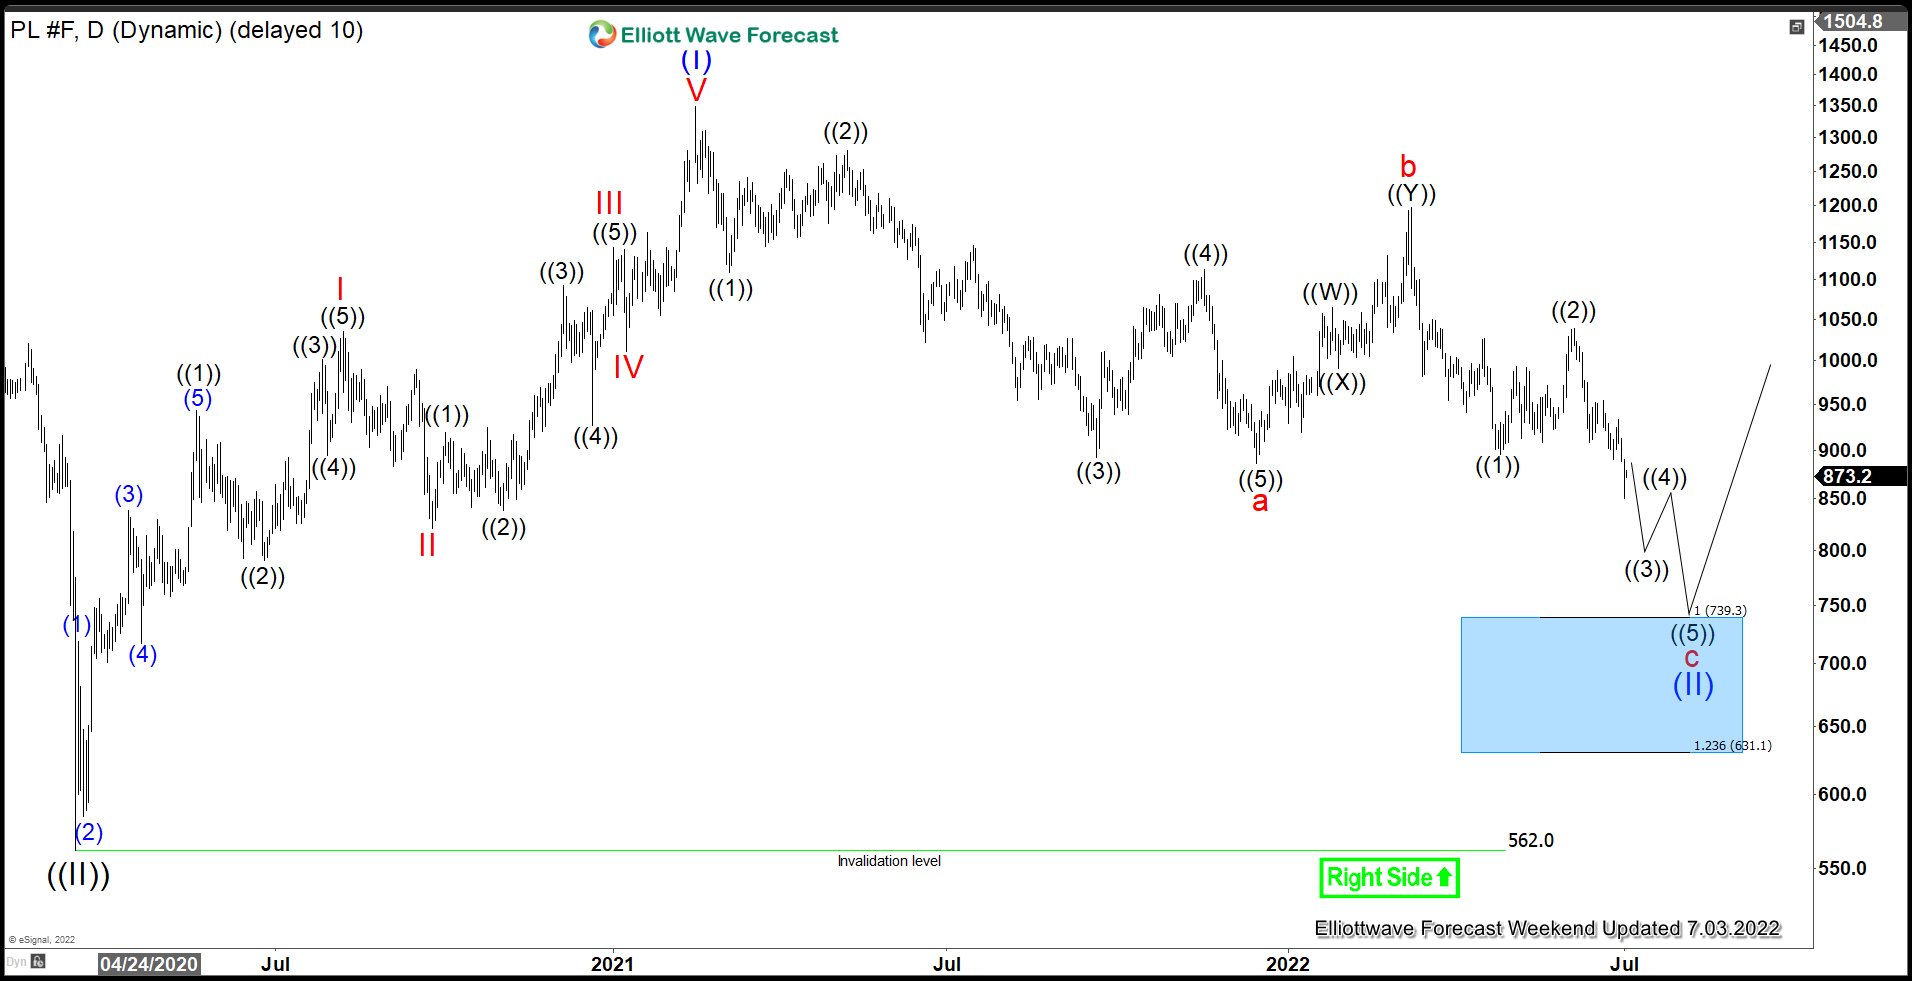
Daily Elliott Wave chart of Platinum above shows the potential support area for wave (II). The pullback is unfolding as a zigzag Elliott Wave structure. Down from wave (I), wave a ended at $886, and wave b ended at $1197. Wave c target can be measured as 100% – 123.6% Fibonacci extension of wave a which comes at $631 – $739 area. This area should see buyers for the next leg higher and give a good buying opportunity.
Source: https://elliottwave-forecast.com/commodities/platinum-support-area/