The Swiss Market Index (SMI) is one of the other Capital Markets worldwide that was building a motive wave from the lows of March 2020. That impulse we called wave I and we believe correction as wave II could be done already after reach a blue box in Daily chart.
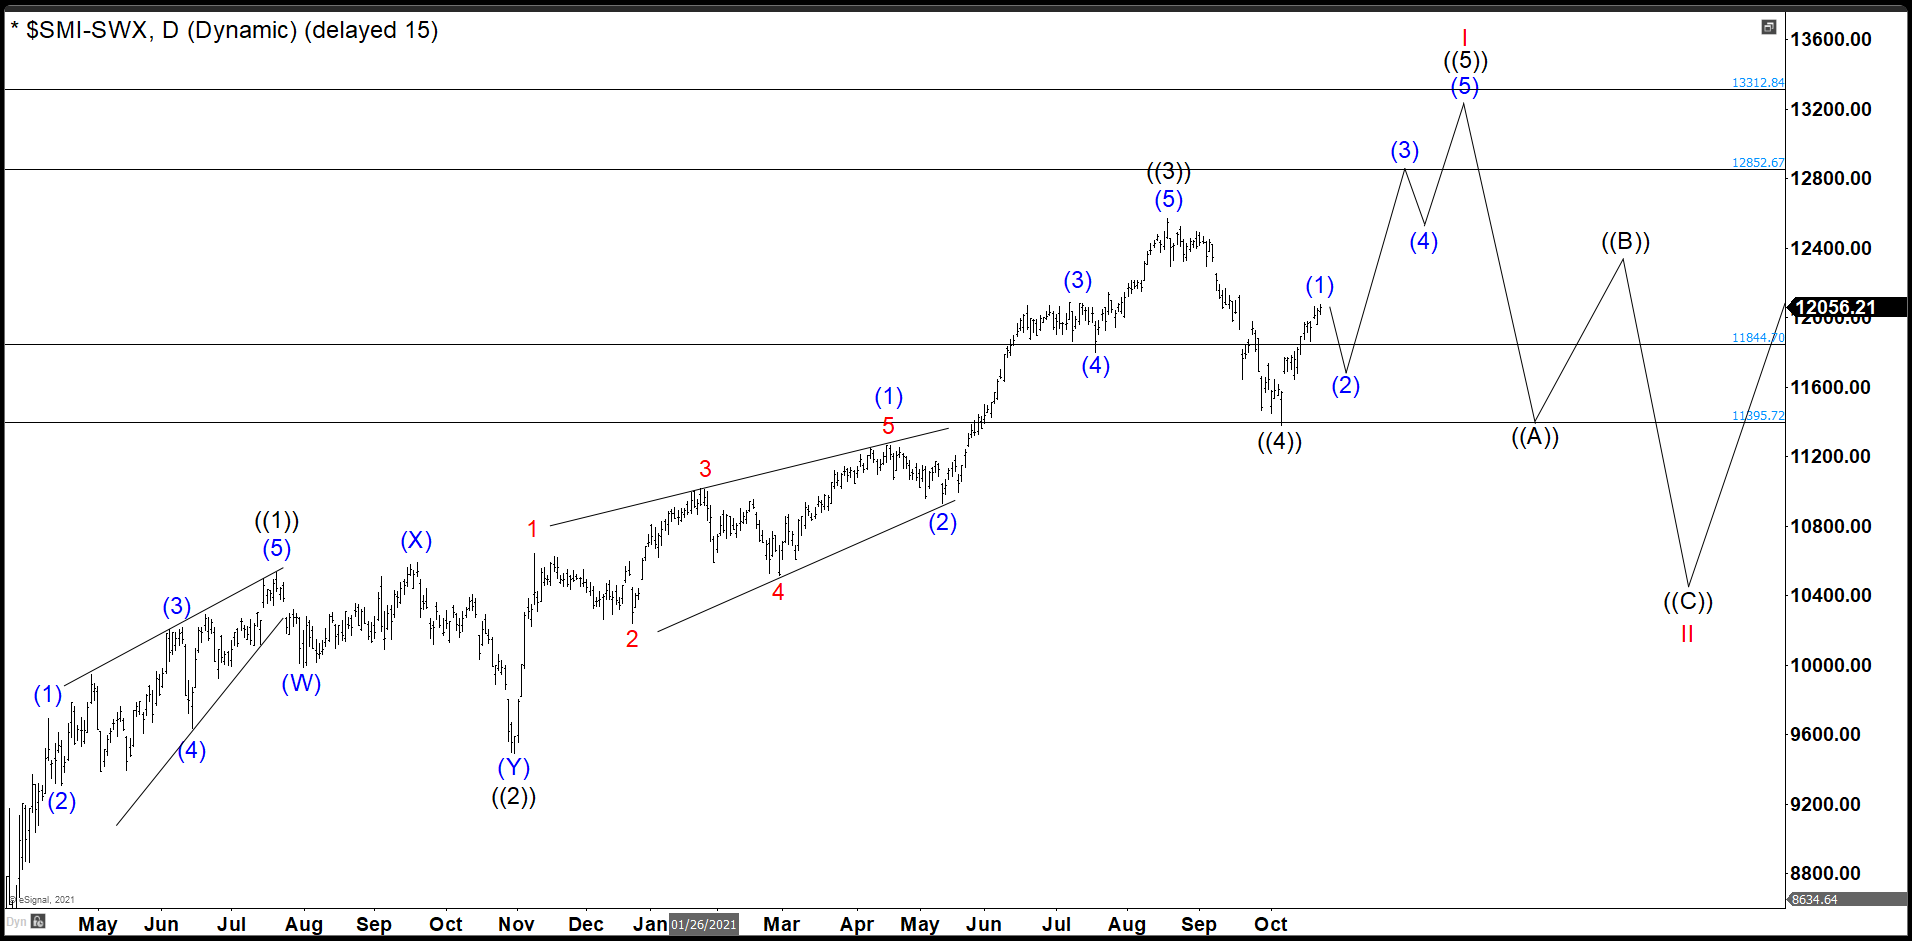
SMI October 22nd Daily Chart

In October last year, the SMI ended wave ((4)) at 11381.74 a little below from our buying area 11844 – 11395. Index bounced nicely and we expected to break wave ((3)) high to reach 12852 – 13312 to complete the impulse from March lows. Then, we look for a pullback to correct the whole cycle in 3 big swings as minimum before continue with the rally.
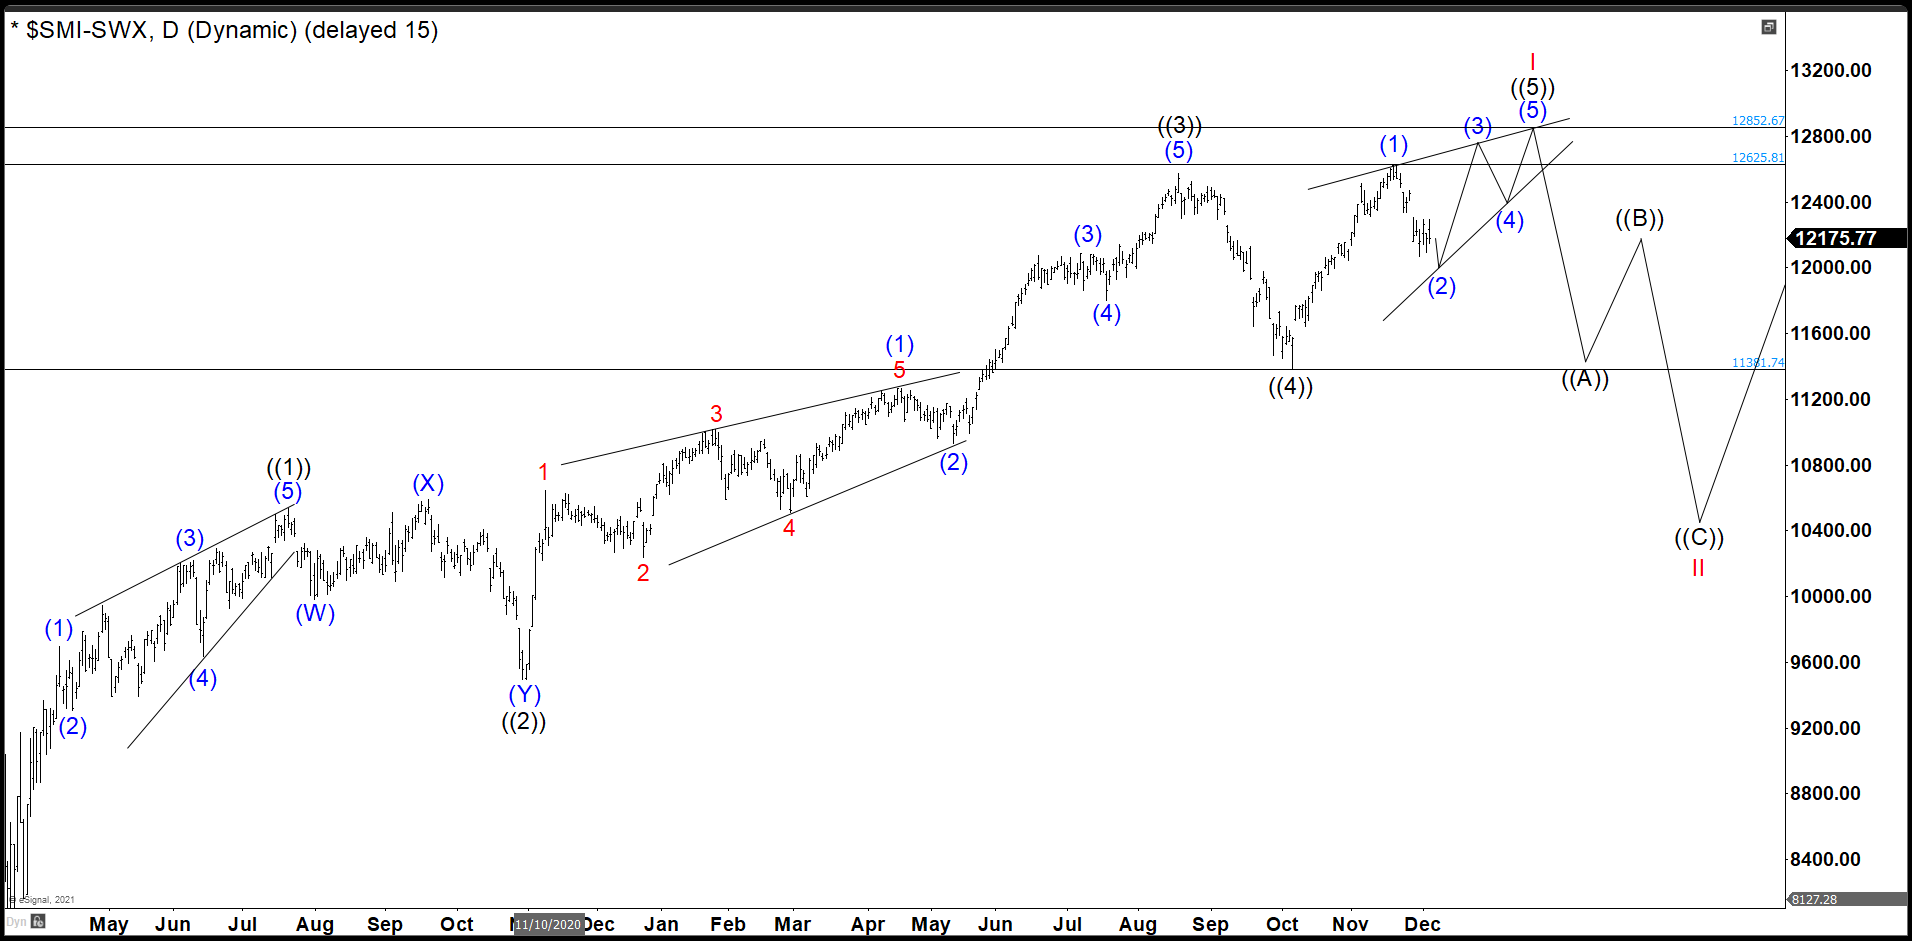
SMI December 04th Daily Chart

The chart above was an alternative view for SMI. As the index did not reach our minimum target at 12852.67, it was still possible to think in an ending diagonal to complete the cycle. For this we needed 2 more slighly highs to complete the pattern and hit our target. This kind of structures can turn the market very strongly; thus, keep in mind this in your future trades. (If you want to learn more about Elliott Wave Theory, please follow these links: Elliott Wave Education and Elliott Wave Theory).
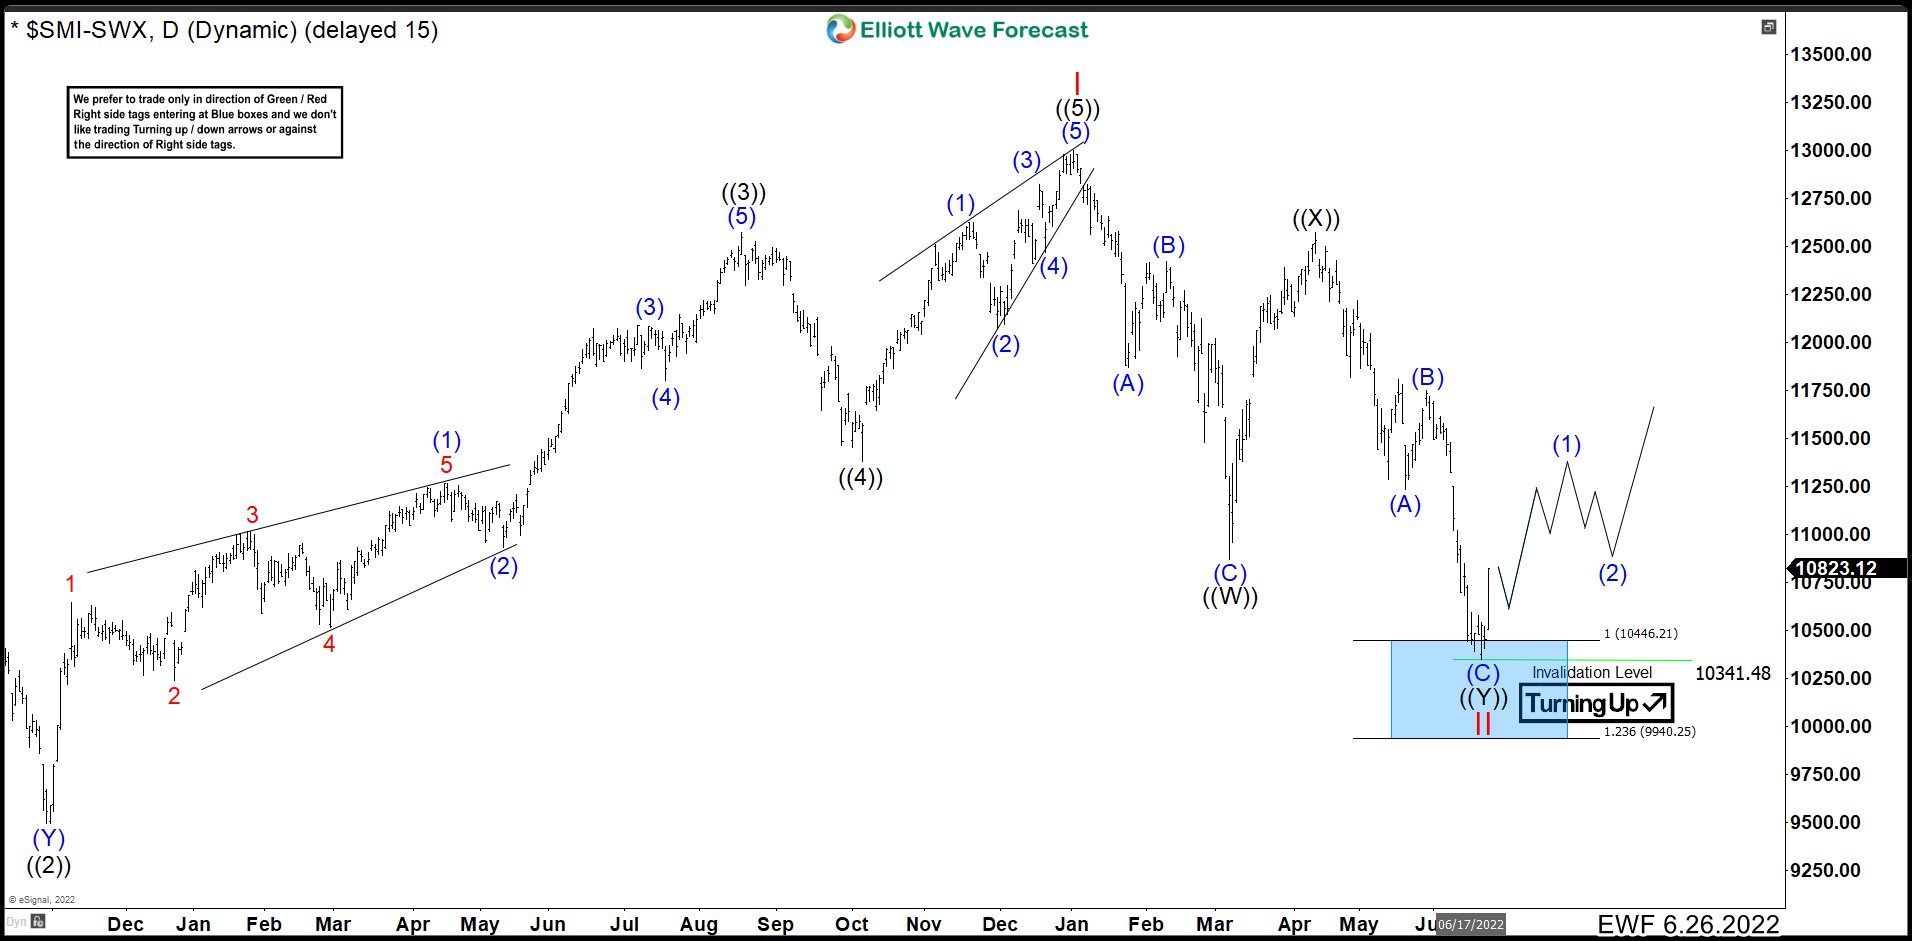
SMI June 26th Daily Chart

After more than 6 months, we can see SMI index ended wave I at 12997 and wave ((5)) as an ending diagonal structure. From here, market did a double correction structure as wave II. A double correction is a 7 swings structure which one join 2 three waves structures by a connector. For the chart above in this case is wave ((X)). The first group of 3 waves ended at 10823 as wave ((W)) and connector wave ((X)) rally to 12567. Last 3 waves structure ended at 10349 completed ((Y)) and the whole correction as wave II. The market dropped to 100% – 123.6% Fibonacci extension given us the idea that pullback could be over.
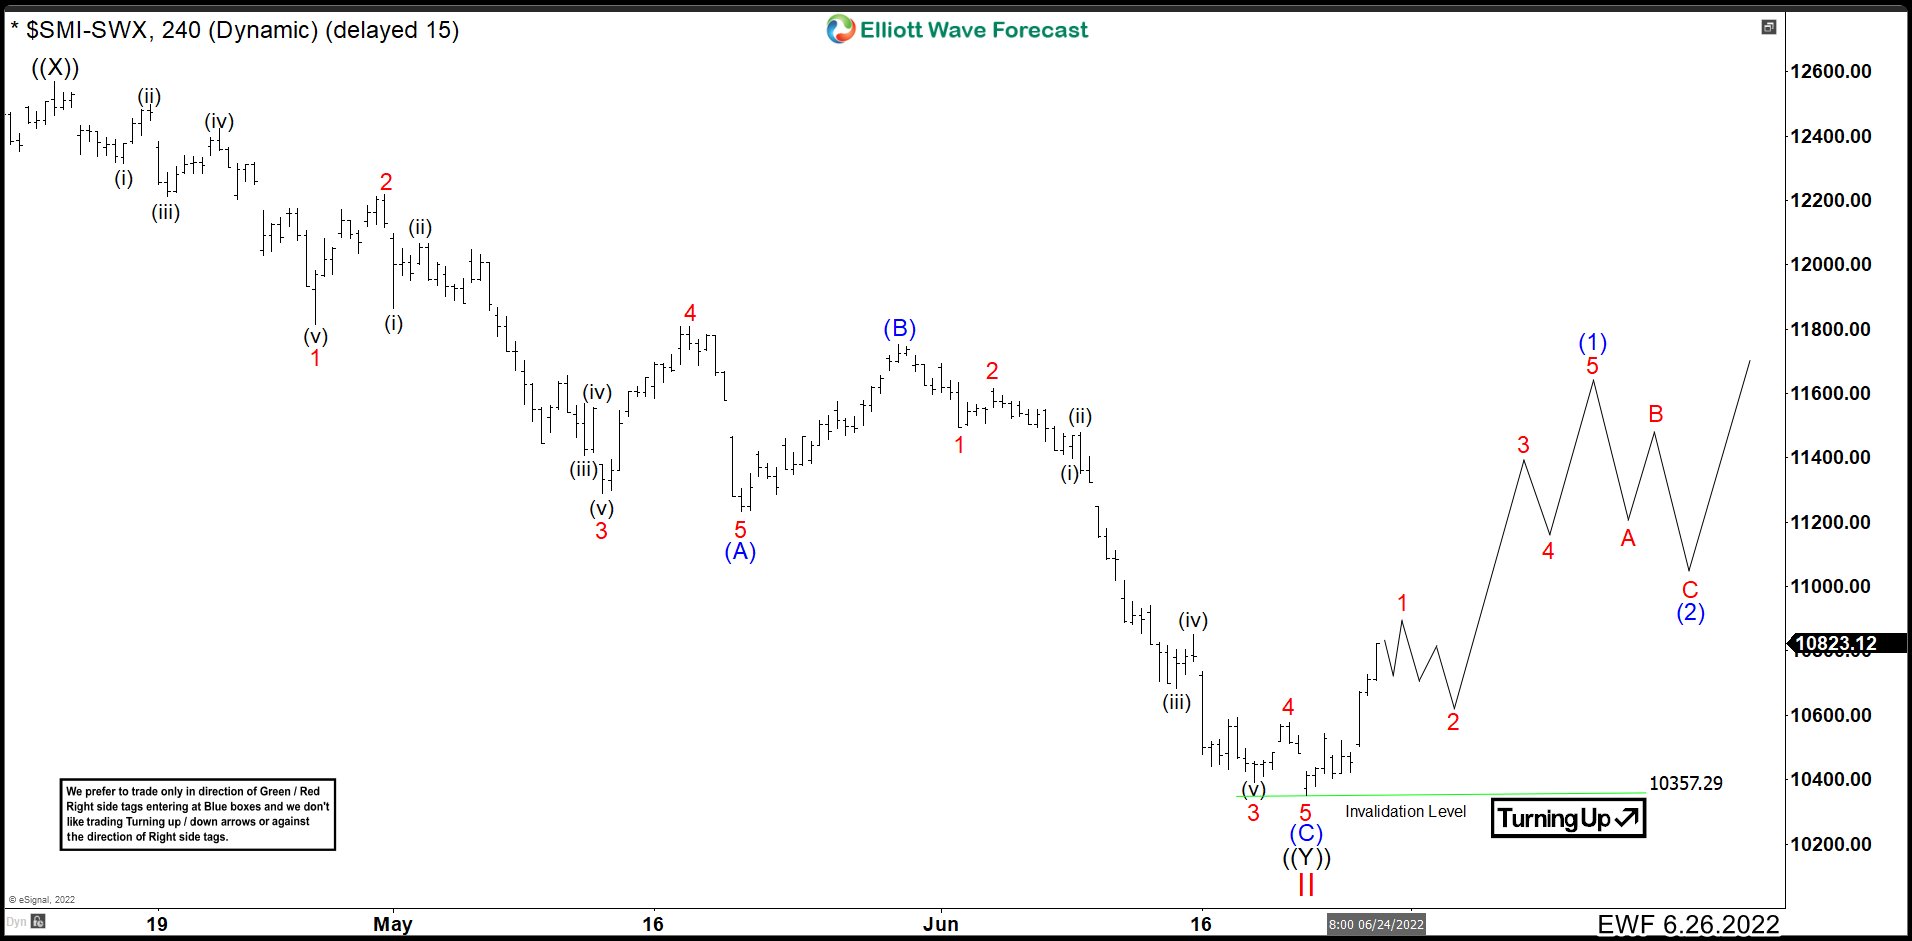
SMI June 26th 4 Hour Chart

Here in the 4 hour chart, it is clear to watch 3 swings lower from wave ((X)) where wave (A) and (C) are impulses. After reach the blue box in the Daily chart, the market has had a nice reaction higher and this should continue higher until complete wave 1. Then we expect a 3, 7 or 11 swings as pullback to stay above 10349, in that case we could have a nice buying opportunity to continue with the rally in long term.
Source: https://elliottwave-forecast.com/stock-market/bull-market-arrived-swiss-index-smi/
