I always wondered why we as Analysts are so talented at Elliott Wave Forecast. We do not have a crystal ball to rub to give us an insight of the future nor are we psychic. This made me wonder even more what makes us so good at reading the market. Then I realised, we are talented because we know how to use the Elliott Wave Theory format to read the market.
Anyone can read a price chart, market goes either up, down or sideways, but does that give you any context? No. I tell you what does give you a complete context of the market, it is being able to count waves so you know what trend we are in, how deep we are in the trend and how long left of it.
H4 Timeframe – 19th May 2022
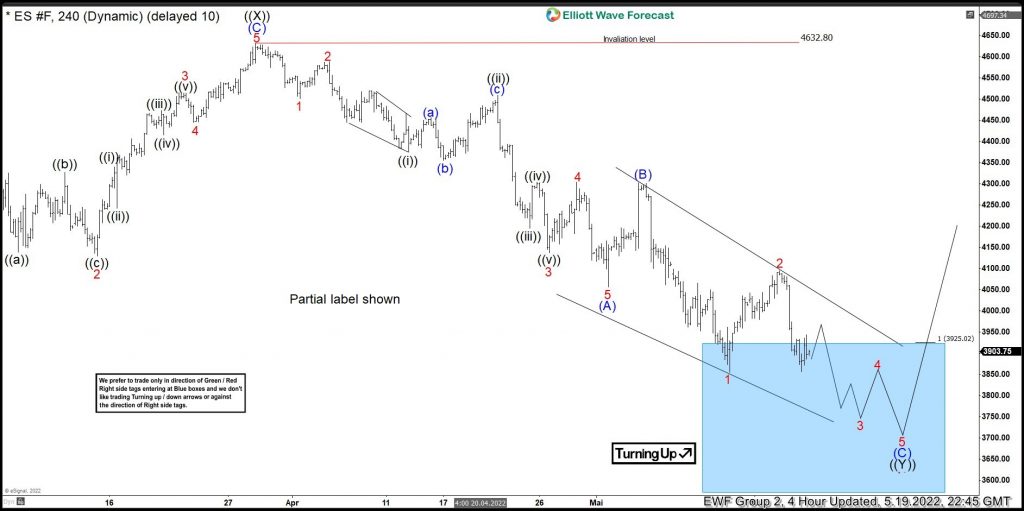
More to the point is that we have been within the corrective cycle on ES since December 2021 highs. Since then price has been unfolding as a double correction. As you can see that wave ((Y)) was unfolding as a ZigZag pattern and we subsequently entered into wave (C)’s 5 wave sequence into the bluebox zone. So we reached equality at 3925 where we entered into the market to go long.
H4 Timeframe – 30th May 2022
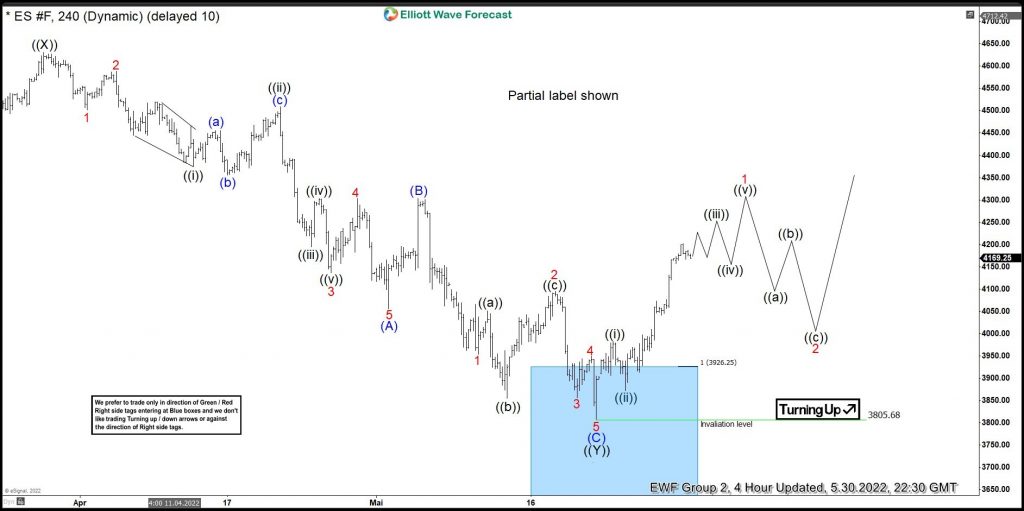
As of 30th May, you can see that we are currently in our way to unfolding in a 5 wave sequence to the upside which would complete wave 1. The main make it or break it situation would be if when wave 1 is done and we are unfolding wave 2. We would need to ensure that wave 2 does not breach through 3805 invalidation level. This would be a clear violation of the Elliott Wave Theory, wave 2 cannot breach through the origin of wave 1.
Source: https://elliottwave-forecast.com/stock-market/es-seems-bottomed-ready-another-rally/