
Cameco (CCJ) is a Canadian-based providers of the uranium fuel, refining, conversion, and fuel manufacturing services. It’s the second largest uranium producer with 18% of the world production. It operates uranium mines in North America and Kazakhstan. As a key component of nuclear energy, uranium can continue to rise higher as the world looks for alternative energies. Amidst soaring oil, gas, and electricity prices, nuclear power points are making a comeback. In addition, the European plan to wean off from its dependence on Russia’s oil and gas necessitate an alternative placement. Below we will look at the technical chart o fone of the largest uranium companies.
$CCJ Monthly Elliott Wave Chart
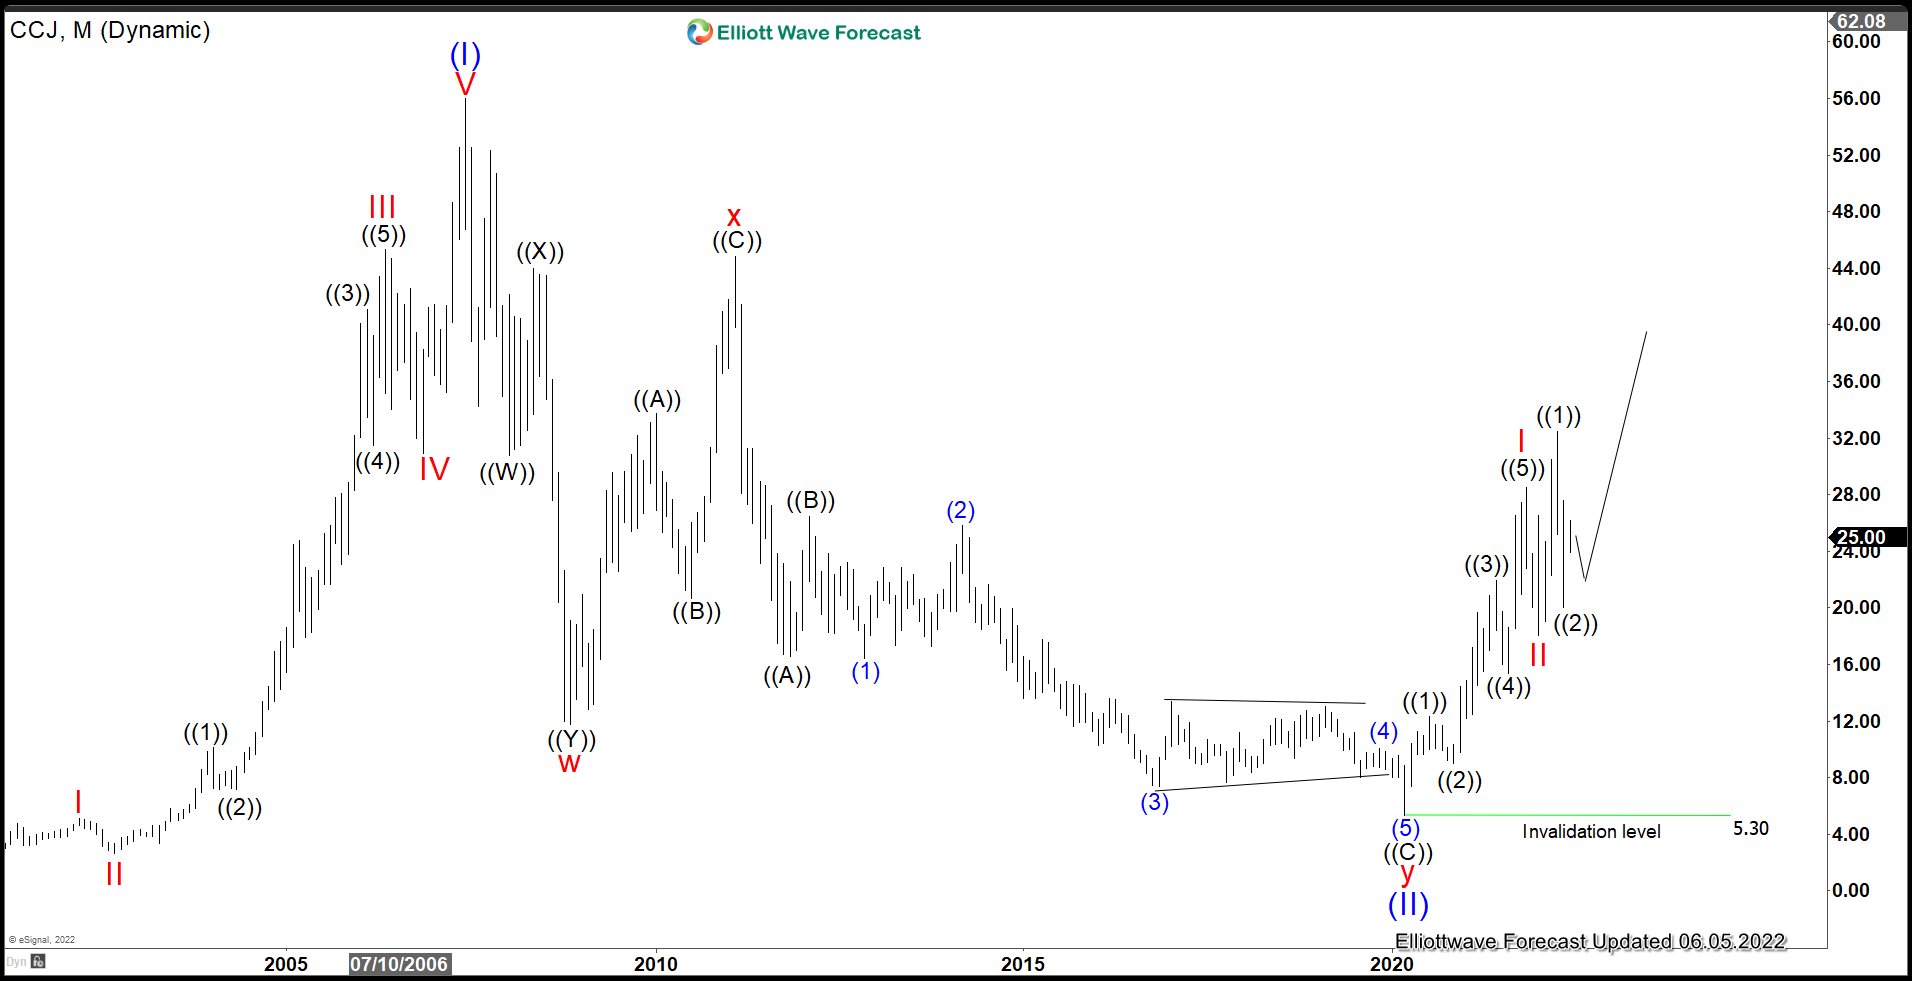
Monthly Elliott Wave View in Cameco (CCJ) above suggests that the stock ended wave (II) pullback at $5.30. From there, it rallies as a 5 waves impulse structure ending wave I at $28.49. Wave II pullback completed at $18.03 and the stock has resumed higher. Wave ((1)) of III ended at $32.49 and dips in wave ((2)) ended at $20.02. Near term, expect the stock to continue extending higher as far as it stays above wave II at $18.03.
$CCJ Alternate Monthly Elliott Wave Chart
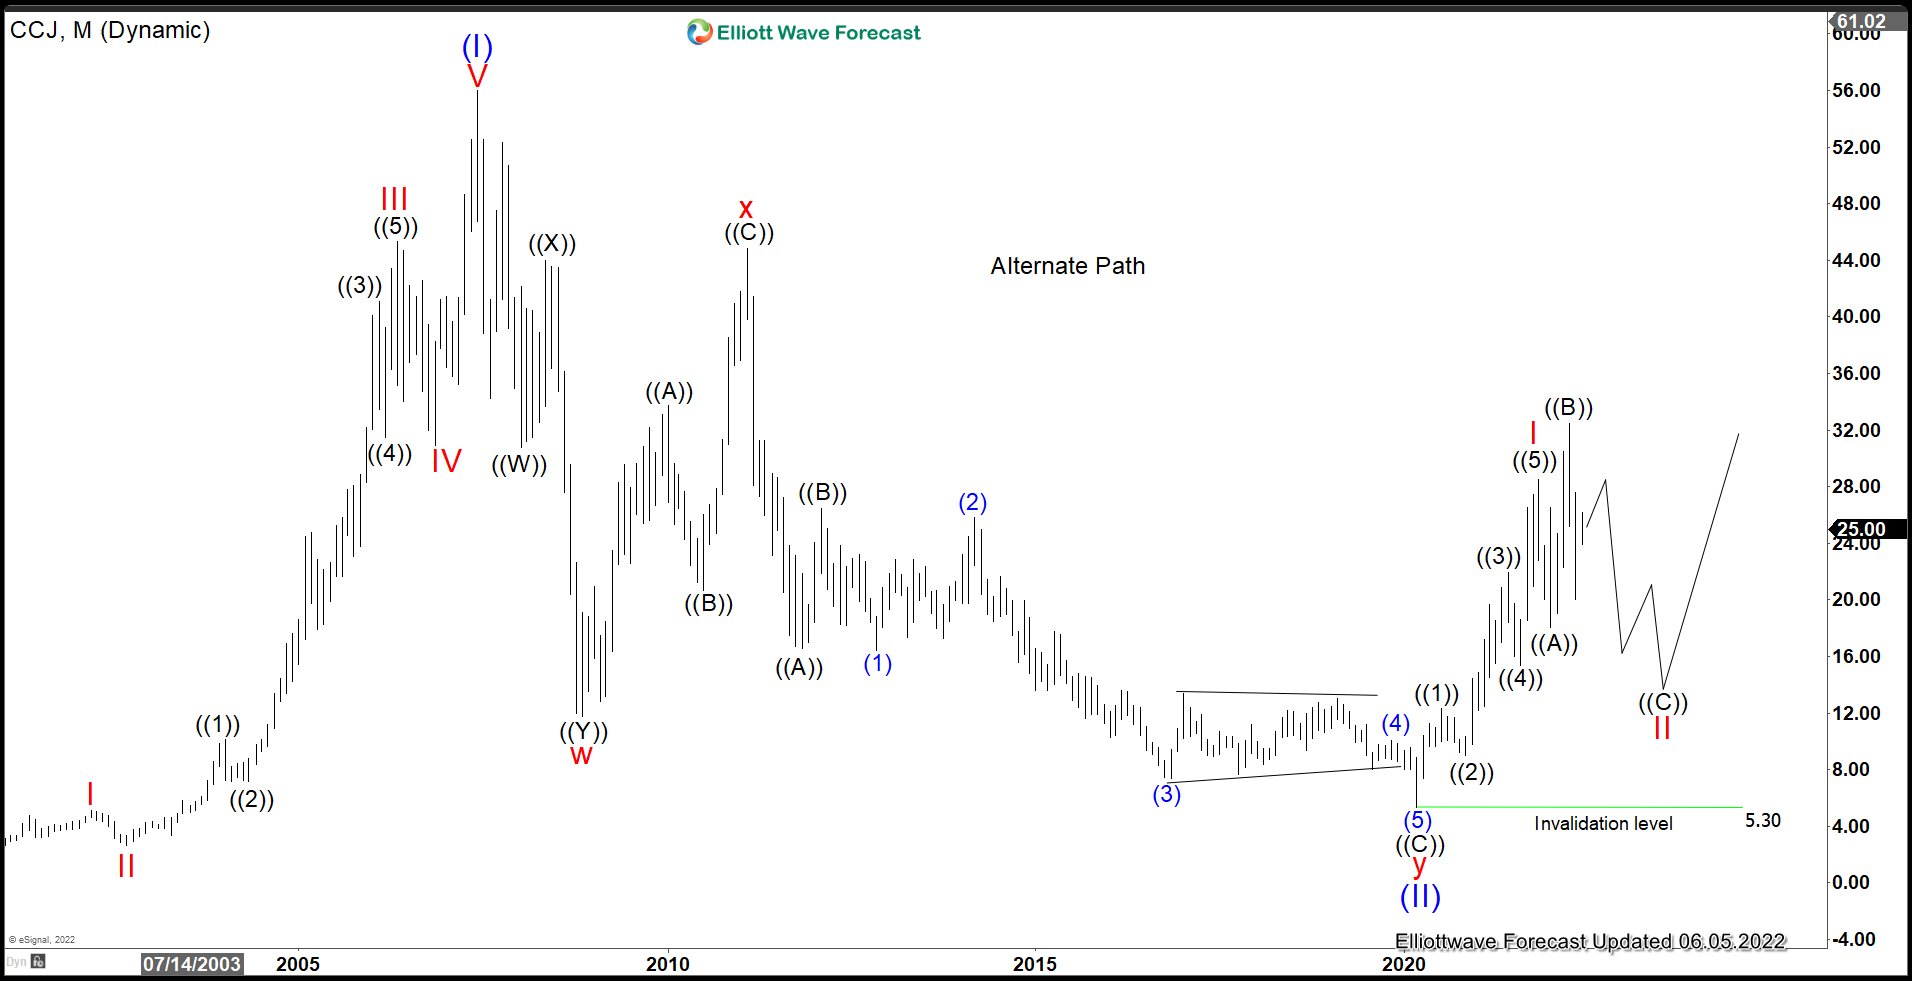
The alternate monthly chart for Cameco above suggests that wave II pullback still remains in progress as an expanded flat to correct the rally from March 2020 low. In this alternate scenario, we should see further downside to end wave ((C)) of II in 5 waves before the rally resumes. As far as pivot at $5.3 low remains intact, expect the stock to continue higher.
Source: https://elliottwave-forecast.com/stock-market/new-bullish-cycle-cameco-ccj/