In this technical blog we’re going to take a quick look at the Elliott Wave charts of USDSEK published in members area of the website. As our members knew, we’ve been favoring the long side in USDSEK due to the fact that many USD pairs been favoring more upside in USD like there are incomplete bearish sequences in AUDUSD, NZDUSD, XAGUSD and a bullish sequence in USDCAD favouring more upside in US Dollar. USDSEK found a peak at May 12, 2022 (10.179) and started pulling back and this pull back took the form of double three Elliott wave correction and members knew it was nothing more than another buying opportunity. In the remainder of the article, we are going to explain the Elliott Wave Pattern and talk about the strategy of blue box buying.
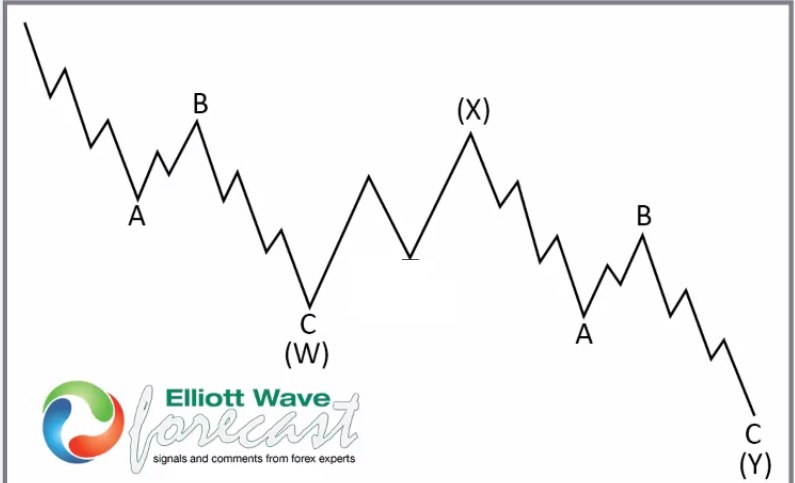
Before we take a look at the real market example, let’s explain Double Three Elliott Wave Structure.
Double Three Elliott Wave Structure is one of the corrective patterns in Elliott Wave theory. Double three is a sideways combination of two corrective patterns. There are several corrective patterns including zigzag, flat, triangle etc. When two of these corrective patterns are combined together, we get a double three. Wave W and Y subdivision can be zigzag, flat and double three of smaller degree or triple three of smaller degree. Wave X can be any corrective structure and double three is a 7 swing structure.

USDSEK 25 May 1 Hour Elliott Wave Asia Update
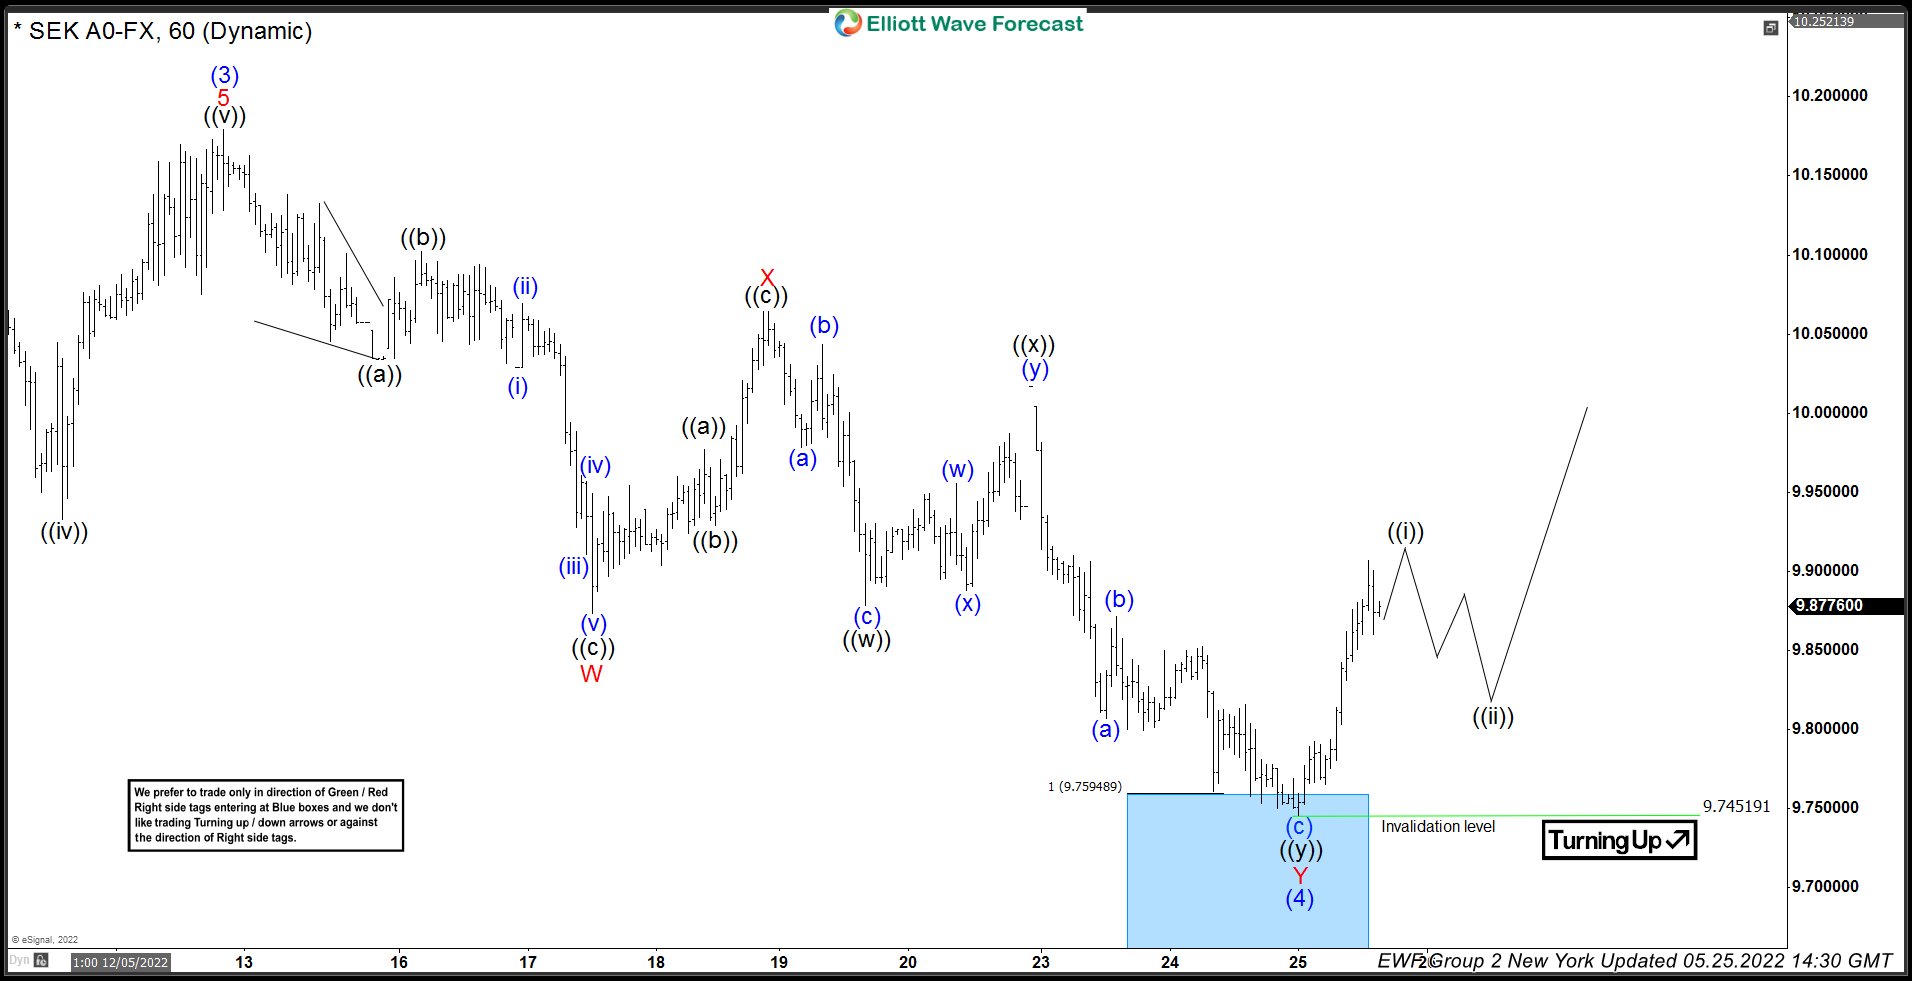
Chart below shows pair in a double three Elliott wave structure lower from May 12, 2022 peak and has reached the blue box which is made up of 100 – 161.8% Fibonacci extension area of wave W related to wave X. Client knew a 7 swing correction should end in this blue box and we should see a turn higher to resume the rally in wave (5) or for 3 waves reaction higher at least.
We don’t like selling the pair against the main bullish trend. Strategy is favoring longs as price already reached the blue box because we still expect at least 1 more leg higher. Once bounce reaches 50 Fibs against red X high, we will make long position risk free by either moving stop loss to entry position or taking partial profits and putting stop on remaining position below the low within the blue box. Invalidation for the trade would be break of marked invalidation level at 9.5683. As our members know, Blue Boxes are no enemy areas , giving us around 80% or a higher chance to get 3 waves bounce at least from the blue box.
USDSEK 25 May 1 Hour Elliott Wave Midday Update
Chart below shows USDSEK has found buyers at the Blue Box area and we are getting good reaction from there. Pull back completed at 9.745 as a double three Elliott wave structure. The rally from the blue box reached and exceeded 50% of the decline from red X peak. Consequently, members who have taken the long trades at the blue box now enjoying profits in a risk free trades. Now we would need to see break of May 12. 2022 peak in order to confirm next leg up is in progress. Until May 12, 2022 high doesn’t break, a double correction lower still can’t be ruled out in which case we would highlight the next blue box buying area for members.
Keep in mind that market is dynamic and presented view could have changed in the mean time. You can check most recent charts in the membership area of the site.

Source: https://elliottwave-forecast.com/forex/usdsek-buying-dips/

