
In this technical blog we’re going to take a quick look at the Elliott Wave charts of NZDJPY published in members area of the website. As our members knew, we’ve been favoring the long side in NZDJPY due to incomplete bullish sequences the pair is showing in the cycles from the March 2020 low against January 2022 low. NZDJPY cycle from January 2022 low ended at April 20, 2022 peak and it started pulling back. This pull back took the form of Elliott Wave Zig Zag pattern and members knew it was nothing more than another buying opportunity. In the remainder of the article, we are going to explain the Elliott Wave Pattern and talk about the blue box buying area.
Before we take a look at the real market example, let’s explain Elliott Wave Zigzag.
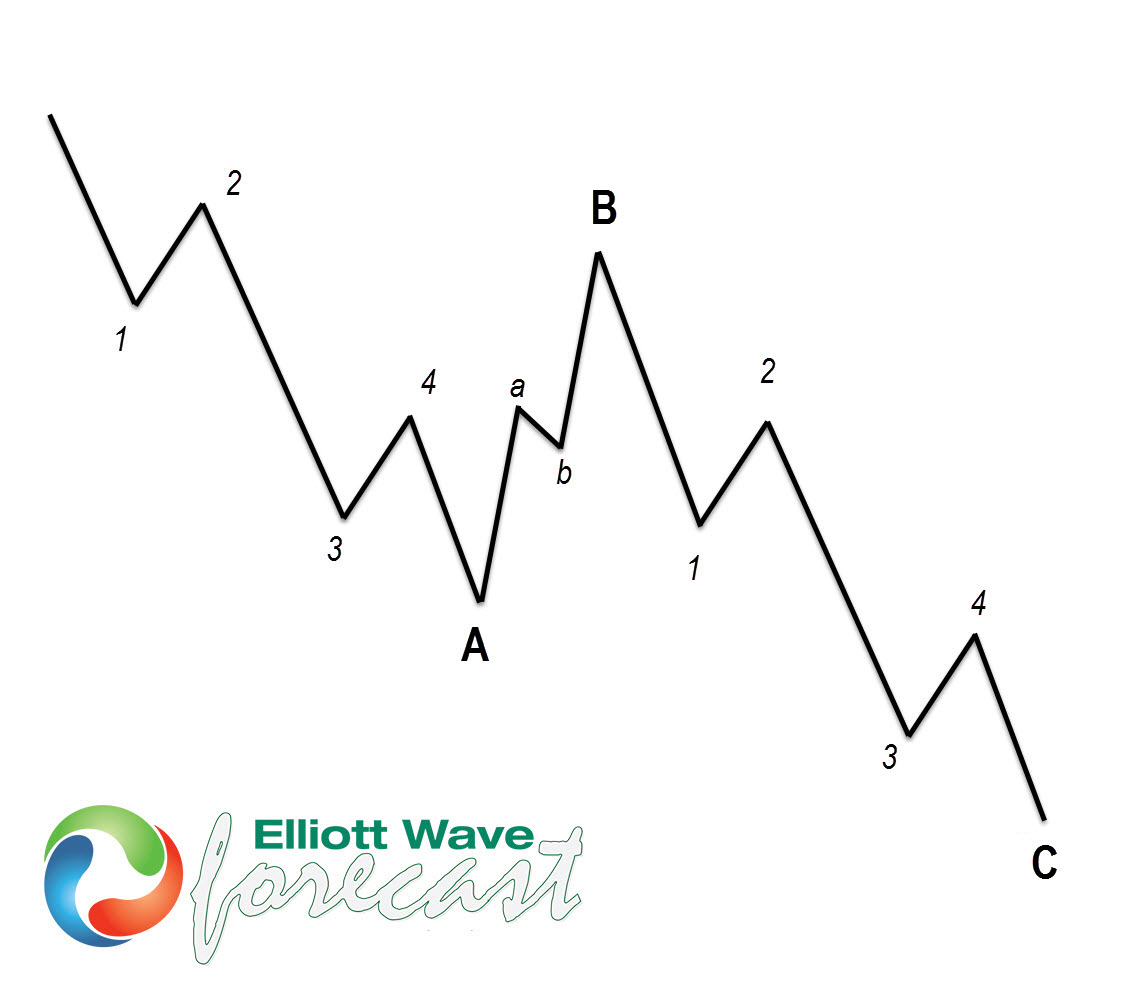
Elliott Wave Zigzag is the most popular corrective pattern in Elliott Wave theory . It’s made of 3 swings and is sub-divided as 5-3-5. Inner swings are labeled as A,B,C where A =5 waves, B=3 waves and C=5 waves. That means A and C can be either impulsive waves or diagonals. (Leading Diagonal in case of wave A or Ending in case of wave C) . Waves A and C must meet all conditions of being 5 wave structure, such as: having RSI divergence between wave subdivisions, ideal Fibonacci extensions and ideal retracements etc. Wave B could be a triangle, FLAT, Zigzag or a double three structure.
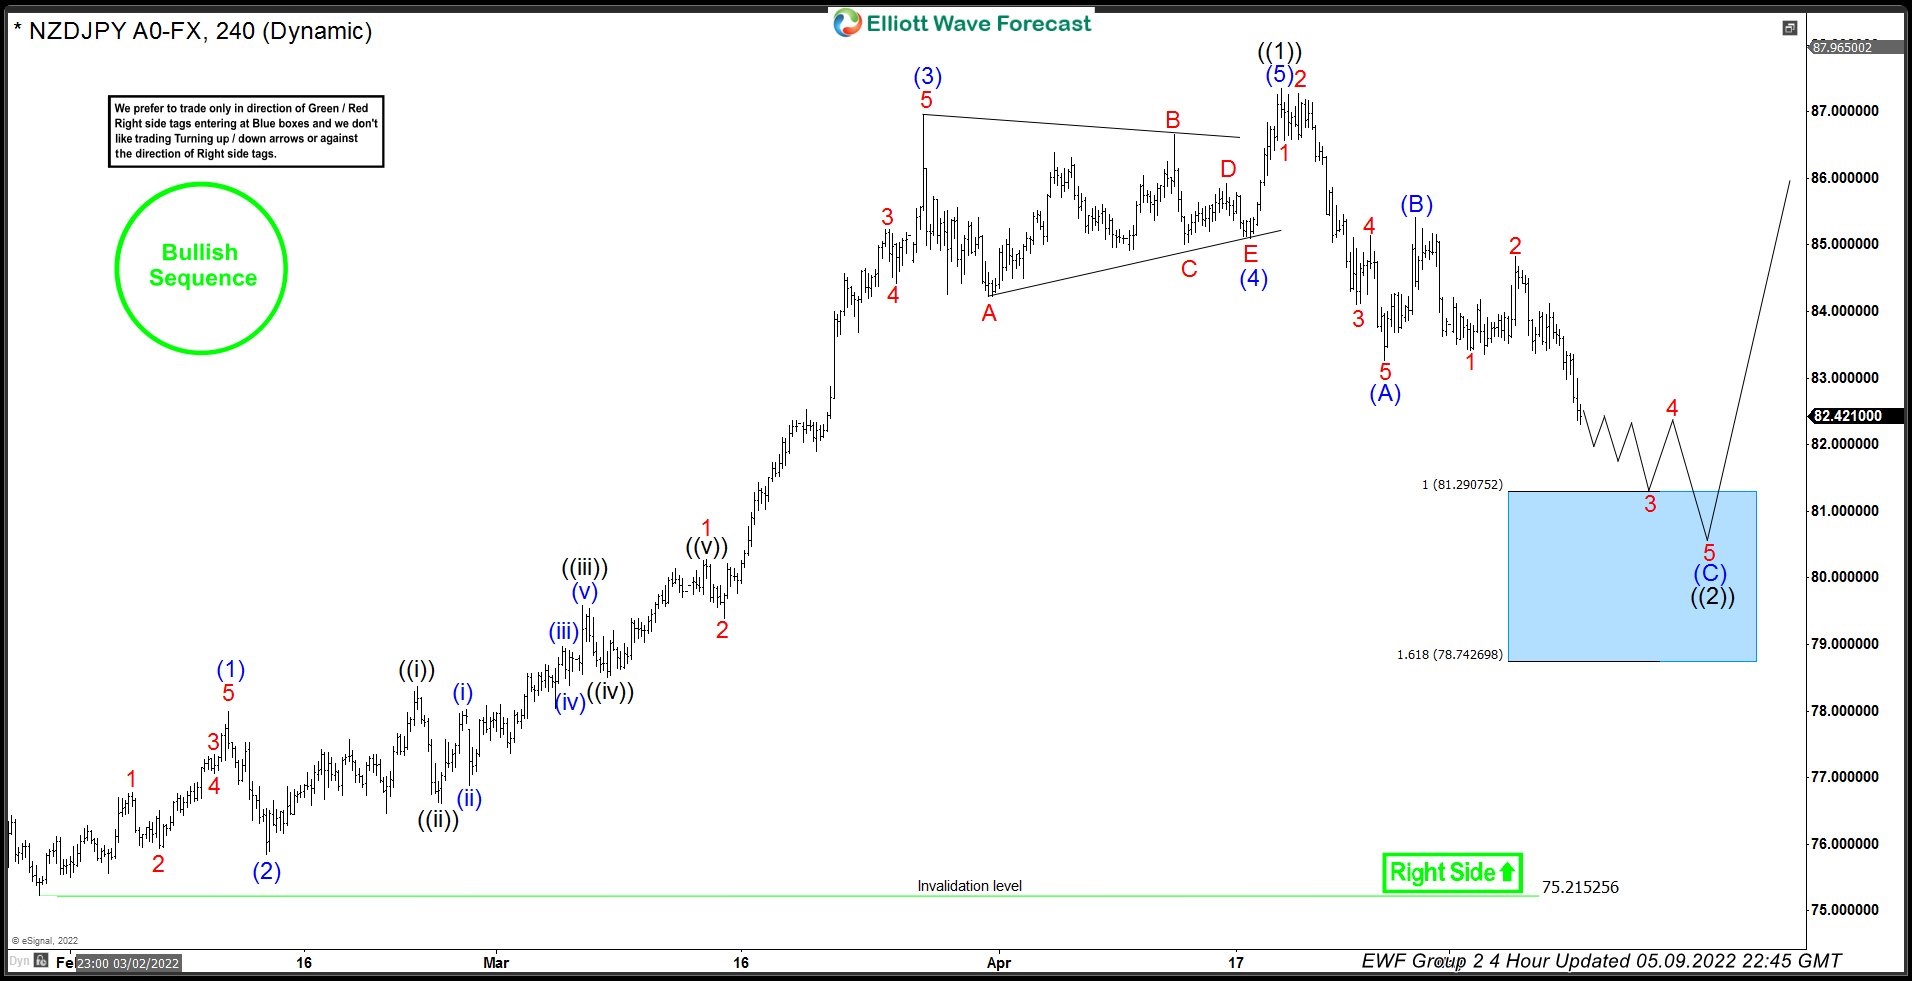
NZDJPY 9 May, 2022 4 Hour Elliott Wave Update
Current view suggests NZDJPY is doing black pull back against the 75.21 low. First leg from the peak was in 5 waves which has been labelled as wave (A). Bounce was corrective and completed as wave (B). We have already seen a new low below wave (A) which makes it an incomplete sequence against April 28, 2022 peak. Current view suggests (C) leg is in progress toward 81.29 – 78.74 area (highlighted with a blue box).
We don’t recommend selling the pair against the main bullish trend. Strategy is waiting for the price to reached marked blue box zone, before buying the pair again. As the main trend is bullish we expect buyers to appear at the blue box for 3 waves bounce at least. Once bounce reaches 50 Fibs against blue (B) high, we will make long position risk free by either moving stop loss to entry position or taking partial profits and putting stop on remaining position below the low within the blue box. Invalidation for the trade would be break of marked invalidation level at 78.74. As our members know, Blue Boxes are no enemy areas , giving us around 80% or a higher chance to get 3 waves bounce at least from the blue box.
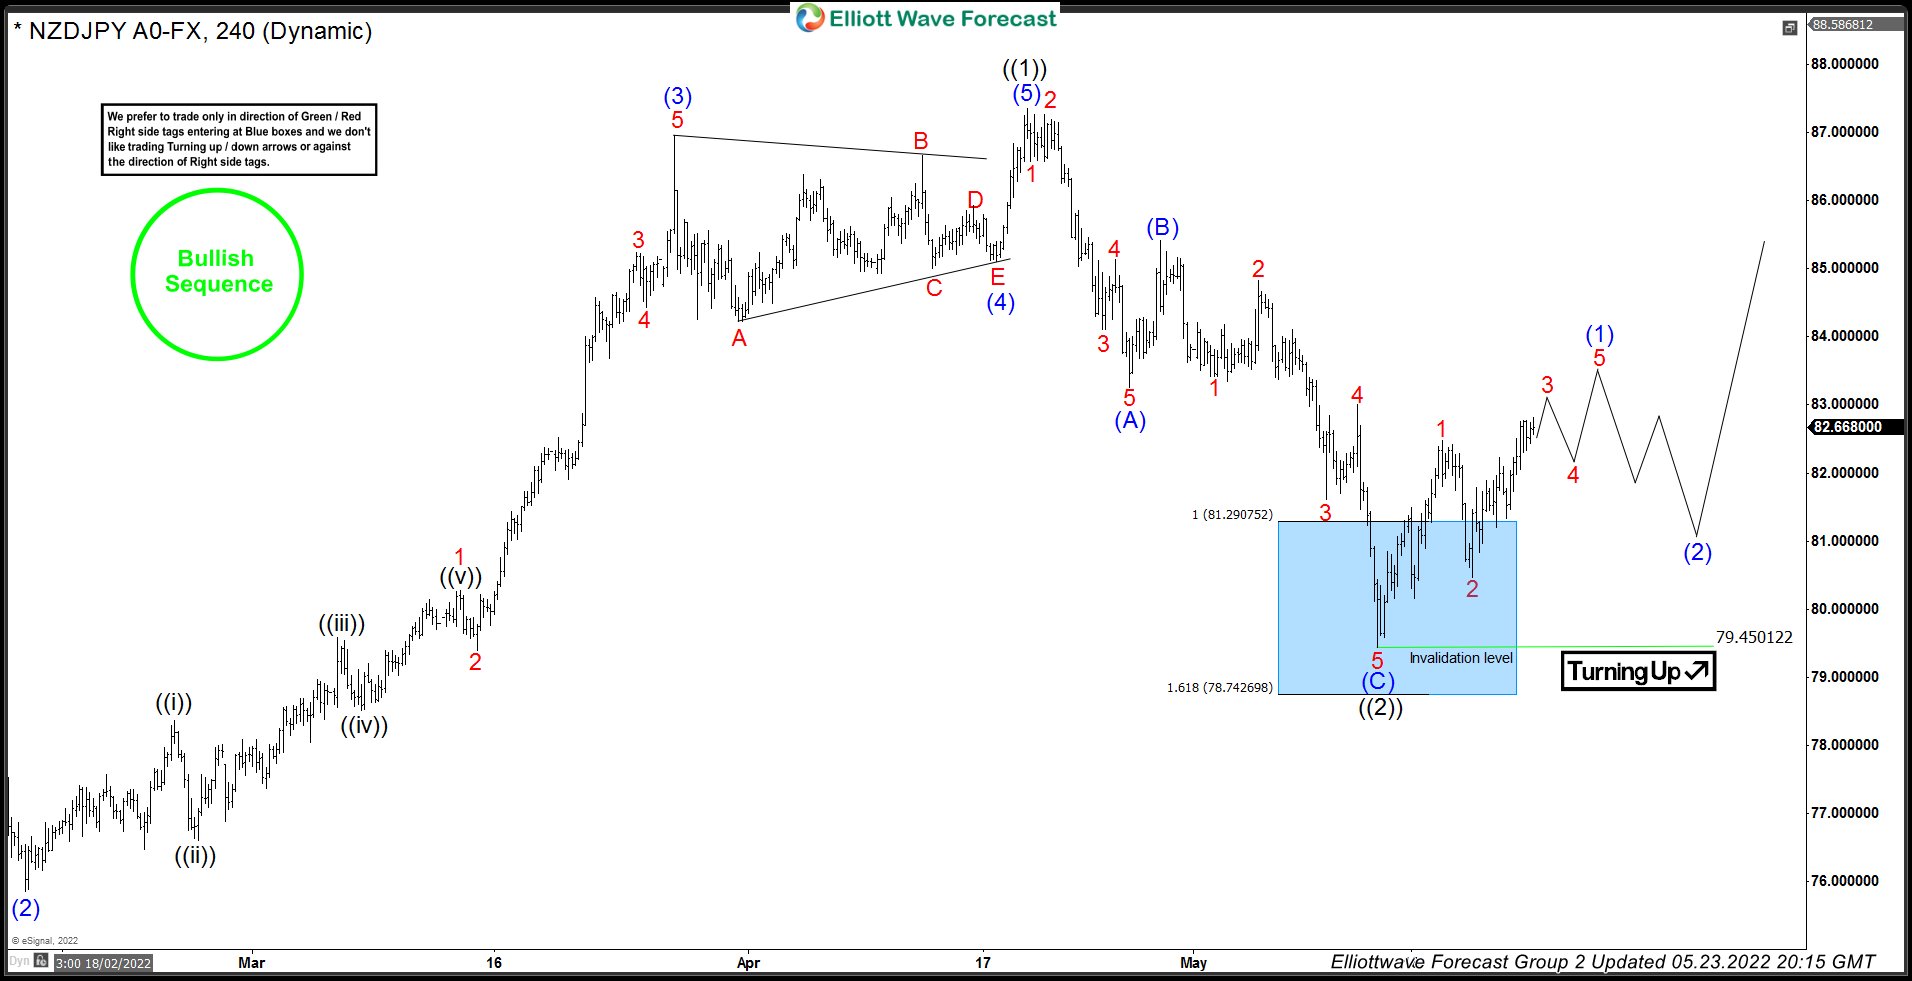
NZDJPY 23 May, 2022 4 Hour Elliott Wave Update
Chart below shows NZDJPY made proposed leg down as we expected. The pair has found buyers at the Blue Box area and we are getting good reaction from there. Pull back completed at 79.45 low as a Zig Zag pattern. The rally from the blue box reached and exceeded 50 fibs against the (B) connector. Consequently, members who have taken the long trades at the blue box now enjoying profits in a risk free trades. Now we would need to see break of April 21st peak in order to confirm next leg up is in progress. Once the pair breaks April 20, 2022 high, the pair will become bullish again in near term and might offer some new buying opportunities in the short term dips against the 132.621 low. Until April 20, 2022 high doesn’t break, a double correction lower still can’t be ruled out in which case we would highlight the next blue box buying area for members.
Keep in mind that market is dynamic and presented view could have changed in the mean time. You can check most recent charts in the membership area of the site.
Source: https://elliottwave-forecast.com/trading/nzdjpy-buying-dip-elliott-wave-zigzag/