
Long Term Cycles & Elliott Wave for $QQQ
Firstly the QQQ instrument inception date was in March 1999. That was before it ended a larger cycle up from the all time lows in March 2000. The ETF instrument mirrors the price movement of the Nasdaq index.
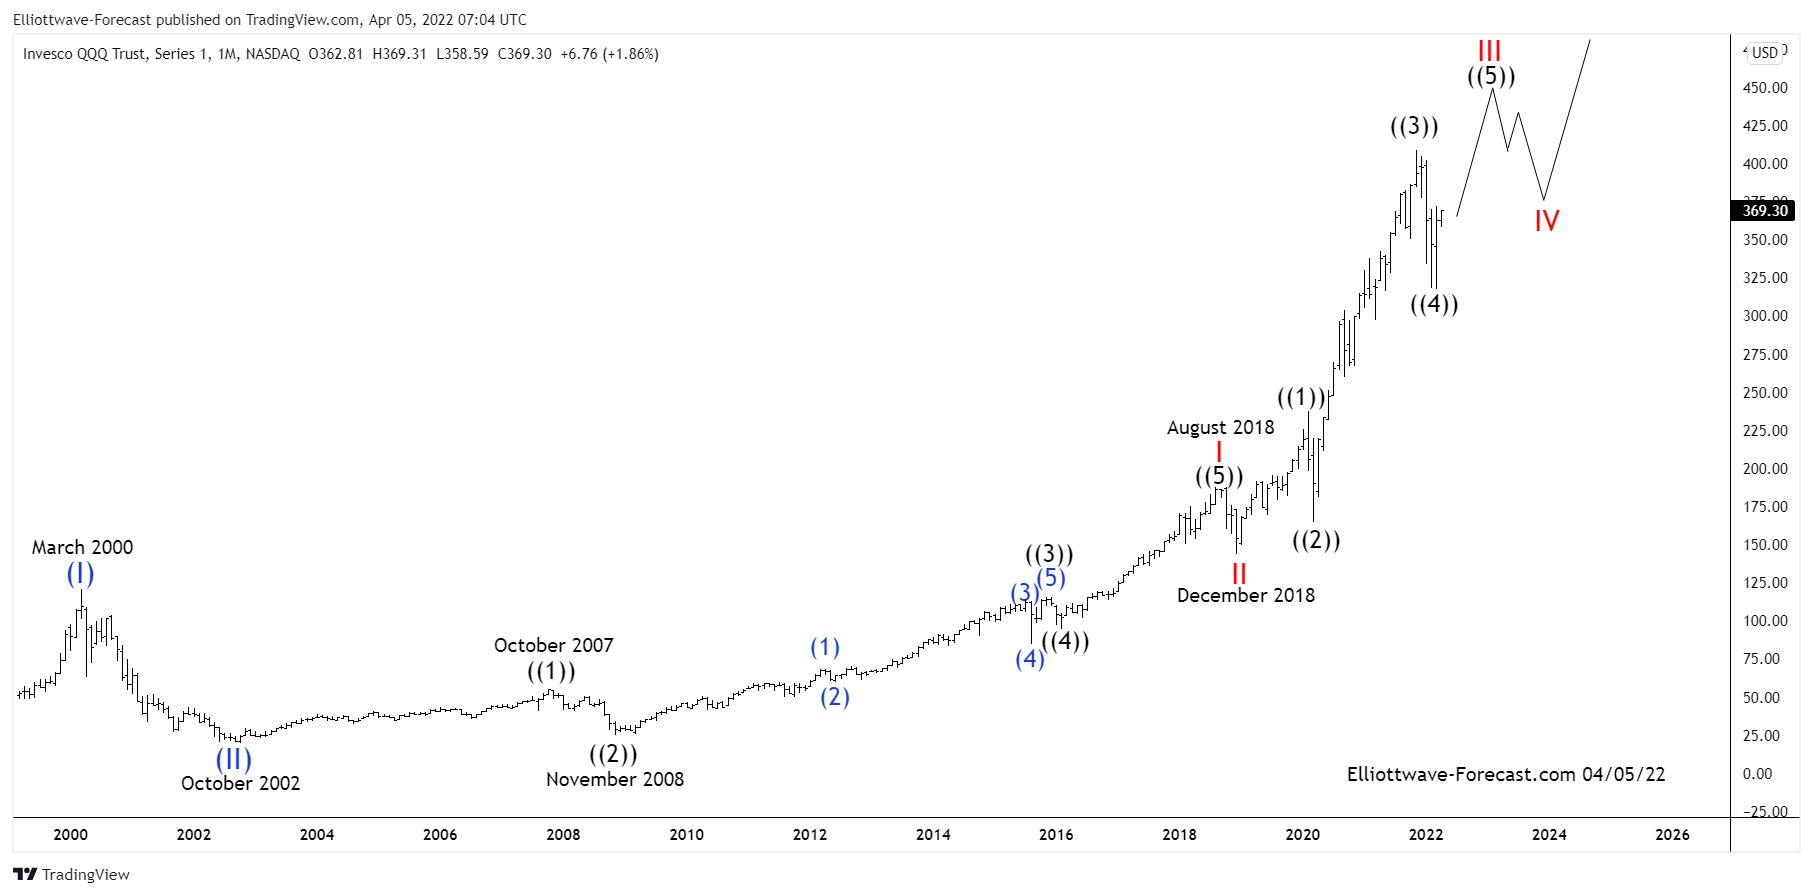
As shown below from the March 2000 highs the instrument had a steep correction lower in three swings to the October 2002 lows. From there to the October 2007 highs it ended the first of the current series of Elliott wave impulses in the black color ((1)). This makes up the subdivisions of the wave ((5)) of the red I that ended on in August 2018. The correction of the cycle up from the October 2002 lows ended the red wave II in December 2018. The pullback into the December 2018 lows was strong in momentum but relatively speaking not so much in price. It suggested it had corrected the whole cycle from the October 2002 low.
The analysis continues below the monthly chart.
Secondly as previously suggested the QQQ instrument mirrors the Nasdaq index cycle highs & cycle lows. As known, impulses progress in 5-9-13-17 swings. Corrections against the trend proceed in 3-7 or 11 swings. So far the bounce from the December 2018 lows appears to be three, larger degree five wave impulse sequences still ongoing. This leaves an incomplete sequence higher.
In conclusion the instrument is bullish most immediately while above the 317.45 lows from March 2022. While above there the instrument should trade higher toward the 455.00 area in wave ((5)). Once that high is established it may see a relatively shallow .236 to .382 Fibonacci retracement of the wave III cycle in wave IV before turning higher again in wave V of (III).
Source: https://elliottwave-forecast.com/stock-market/long-term-cycles-elliott-wave-for-qqq/