
Hello Fellow Traders. In this technical blog we’re going to take a look at the Elliott Wave charts charts of AUDUSD forex pair published in members area of the website. As our members know the pair is showing incomplete sequences in the cycle from the February 2021 peak. The price structure is calling for a further weakness. Recently we got 3 waves recovery against October 2021 peak that completed at 0.744 high. In further text we are going to explain short term path.
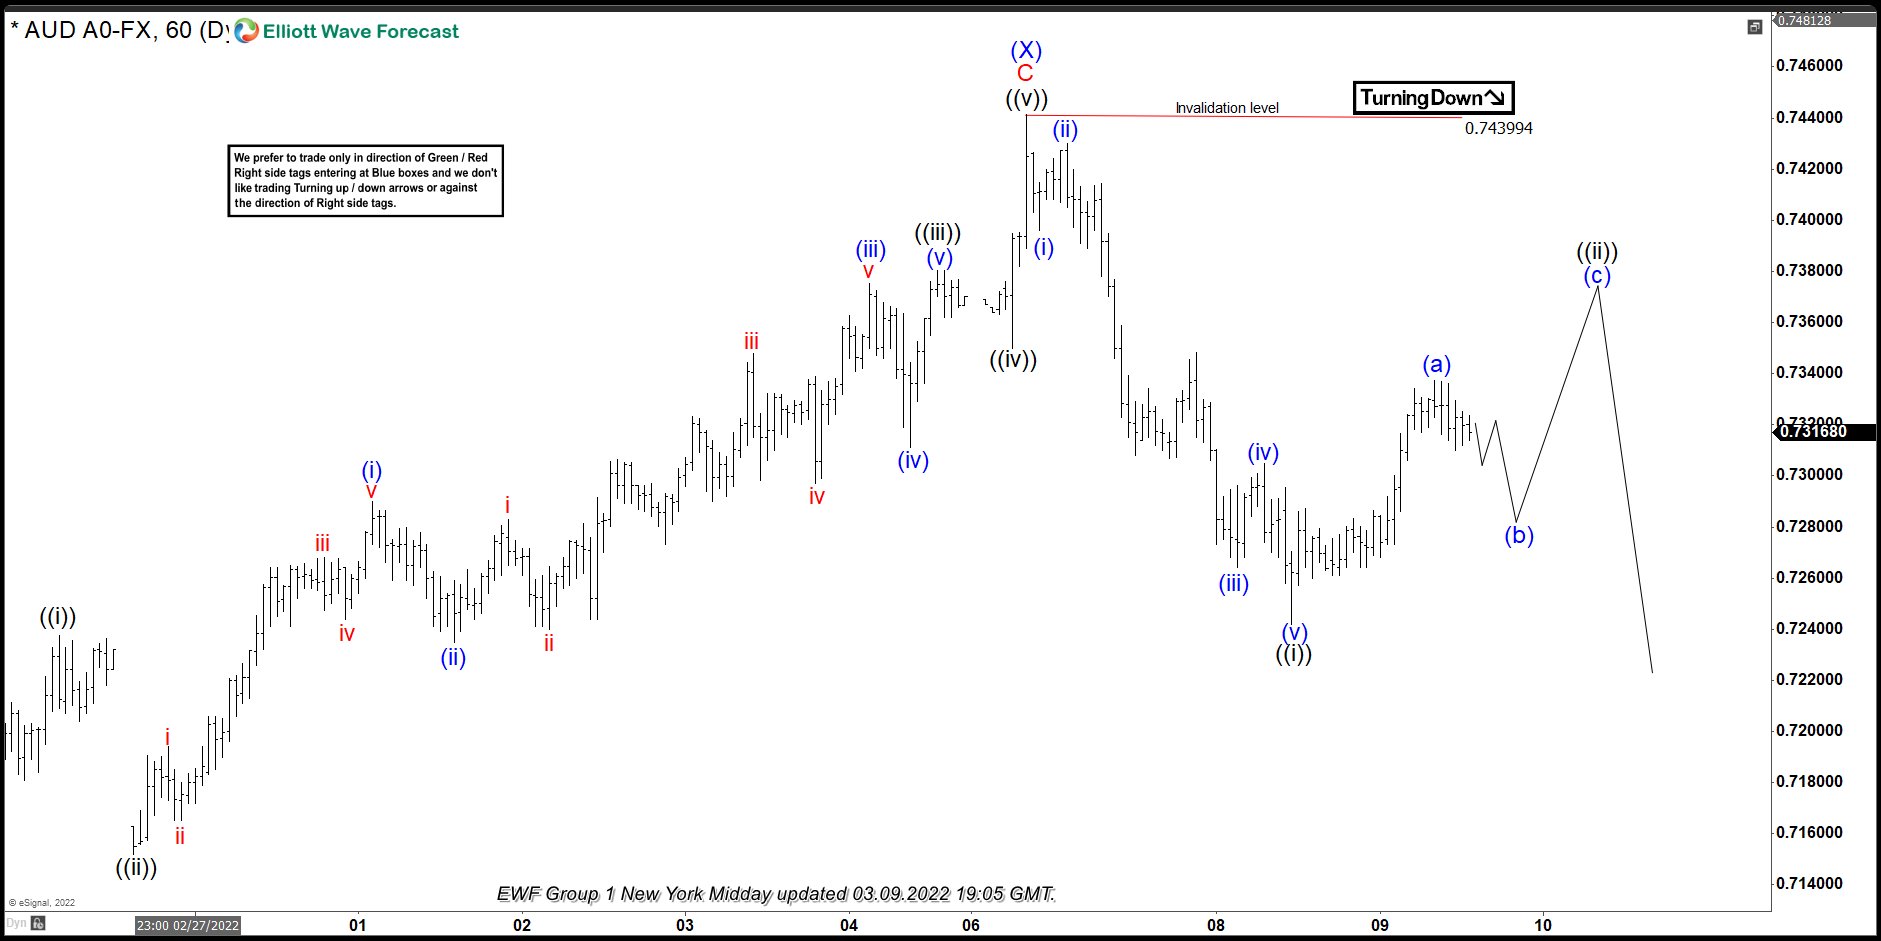
AUDUSD H1 Hour Elliott Wave Analysis 03.09.2022.
At this stage we see possibility that the pair ended cycle from the 01/28 low at 0.74399 high. AUDUSD made 5 waves down from the 0.743994 peak, increasing chances of further decline. Currently the pair is giving us short term bounce against the mentioned high. At this moment, rally from the lows looks like 5 waves. So, we assume the pair has given us only first leg of the short term recovery. We are looking for a pull back in (b) and another leg up against the 0.74399 peak ideally.
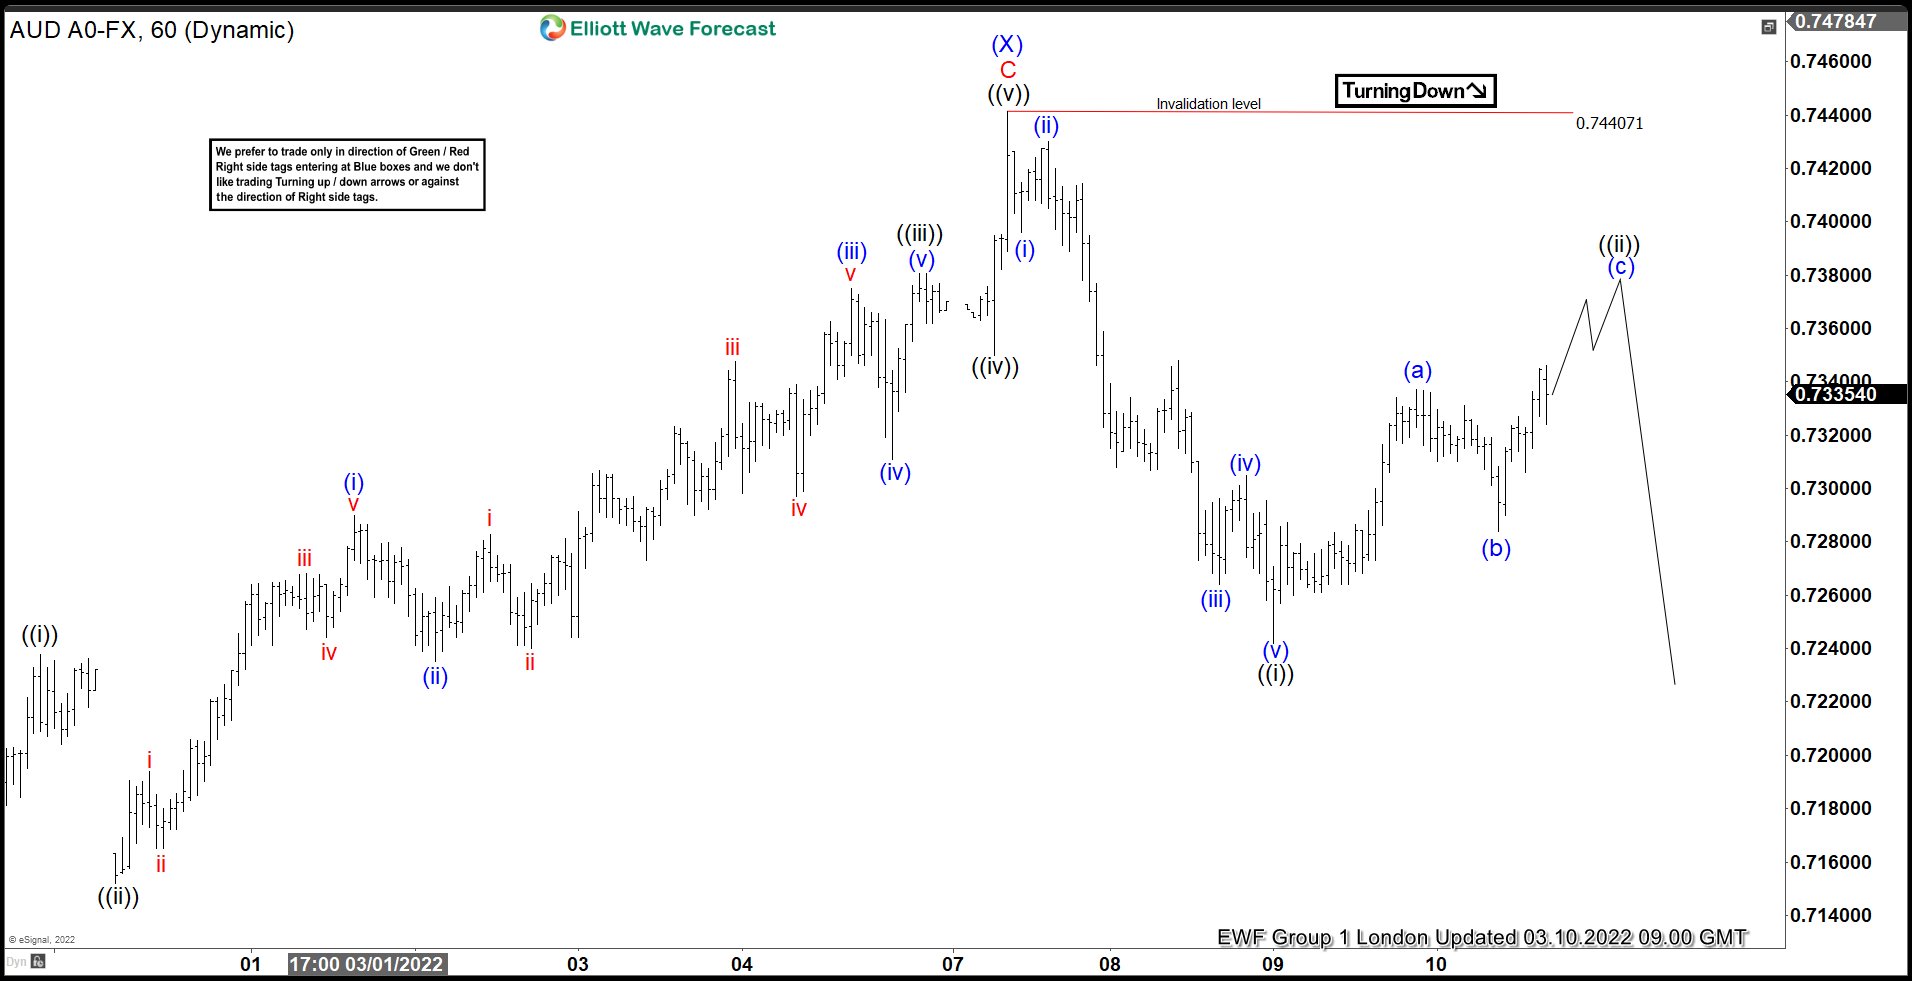
AUDUSD H1 Hour Elliott Wave Analysis 03.10.2022.
AUDUSD has given us 3 waves pull back in (b) blue, and rally which broke (a) peak , confirming (c) leg up is in progress, ideally toward 0.7381+ area. Wave ((ii)) black must complete below 0.74407 peak. Otherwise break above that high would invalidate the current Elliott Wave count. We expect further decline as far as mentioned 0.74407 high holds.
You can learn more about Elliott Wave Patterns at our Free Elliott Wave Educational Web Page
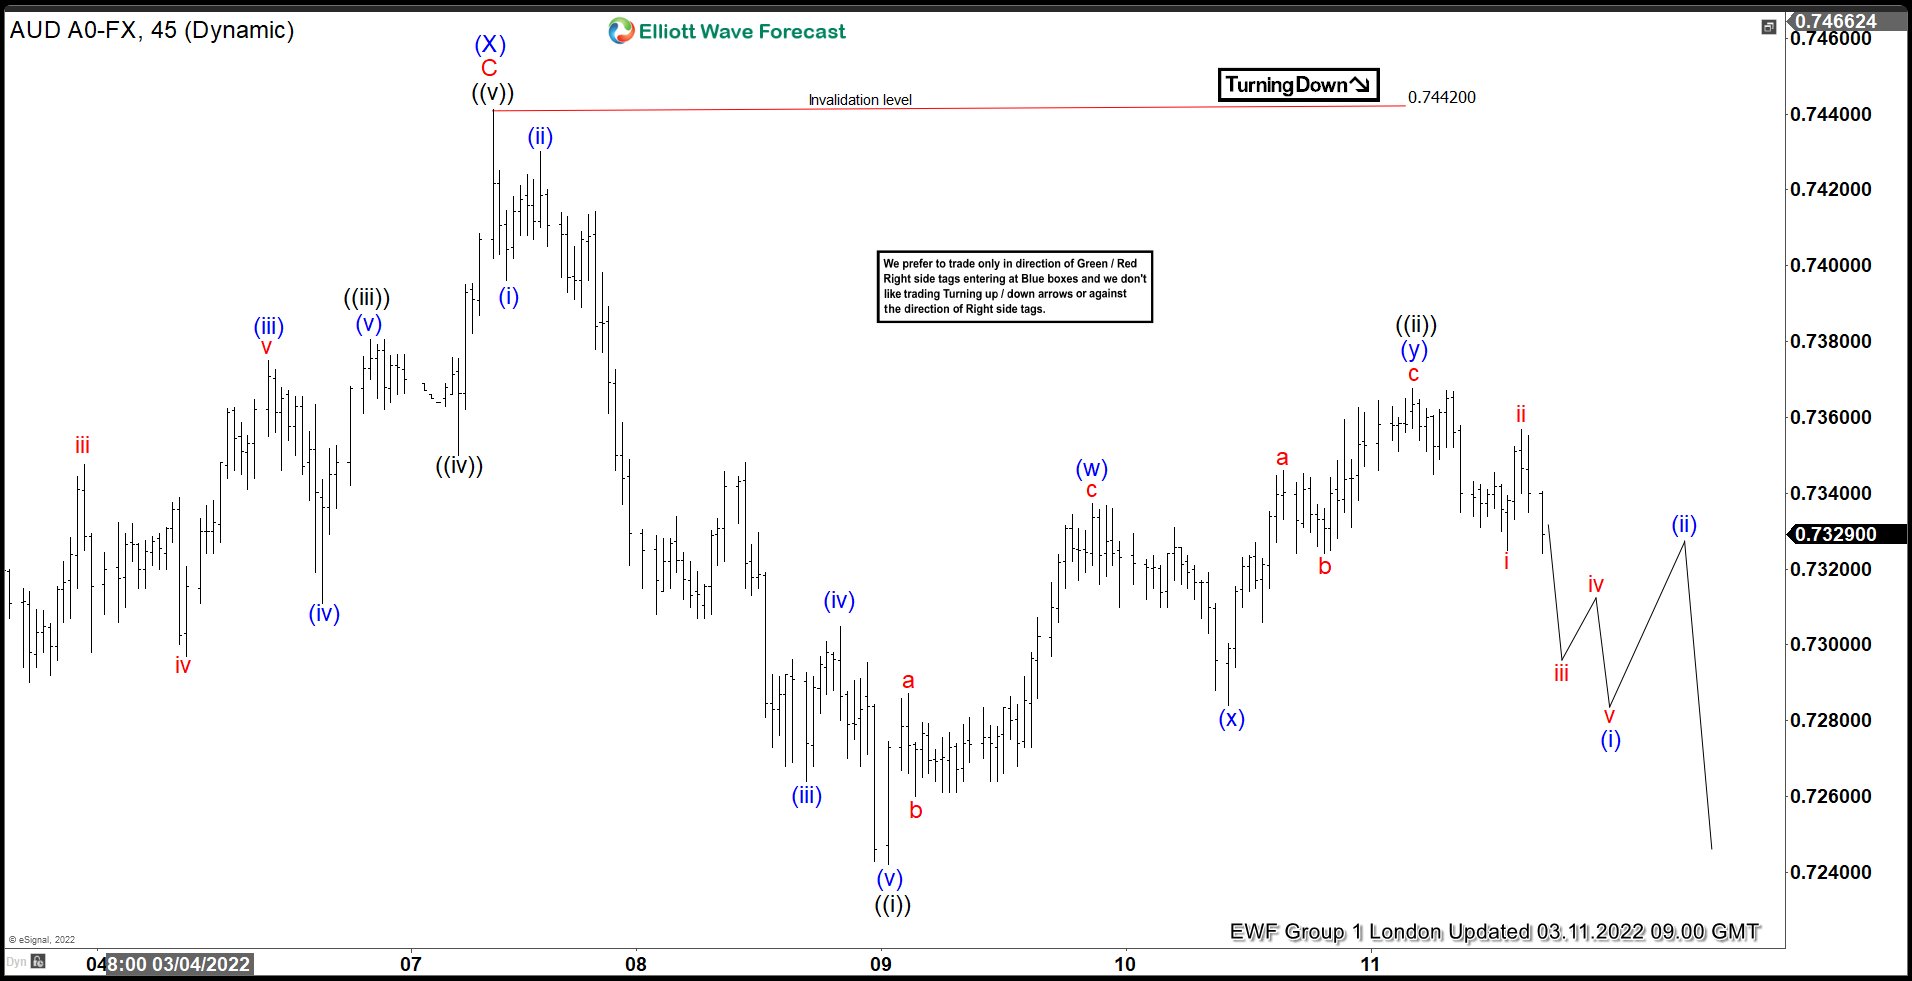
AUDUSD H1 Hour Elliott Wave Analysis 03.11.2022.
Short term recovery ((ii)) black looks completed at 0.7366 high as truncation. As far as the price holds below that high, the pair can be trading lower in ((iii)) black leg, targeting 0.7175-0.7129 area next.
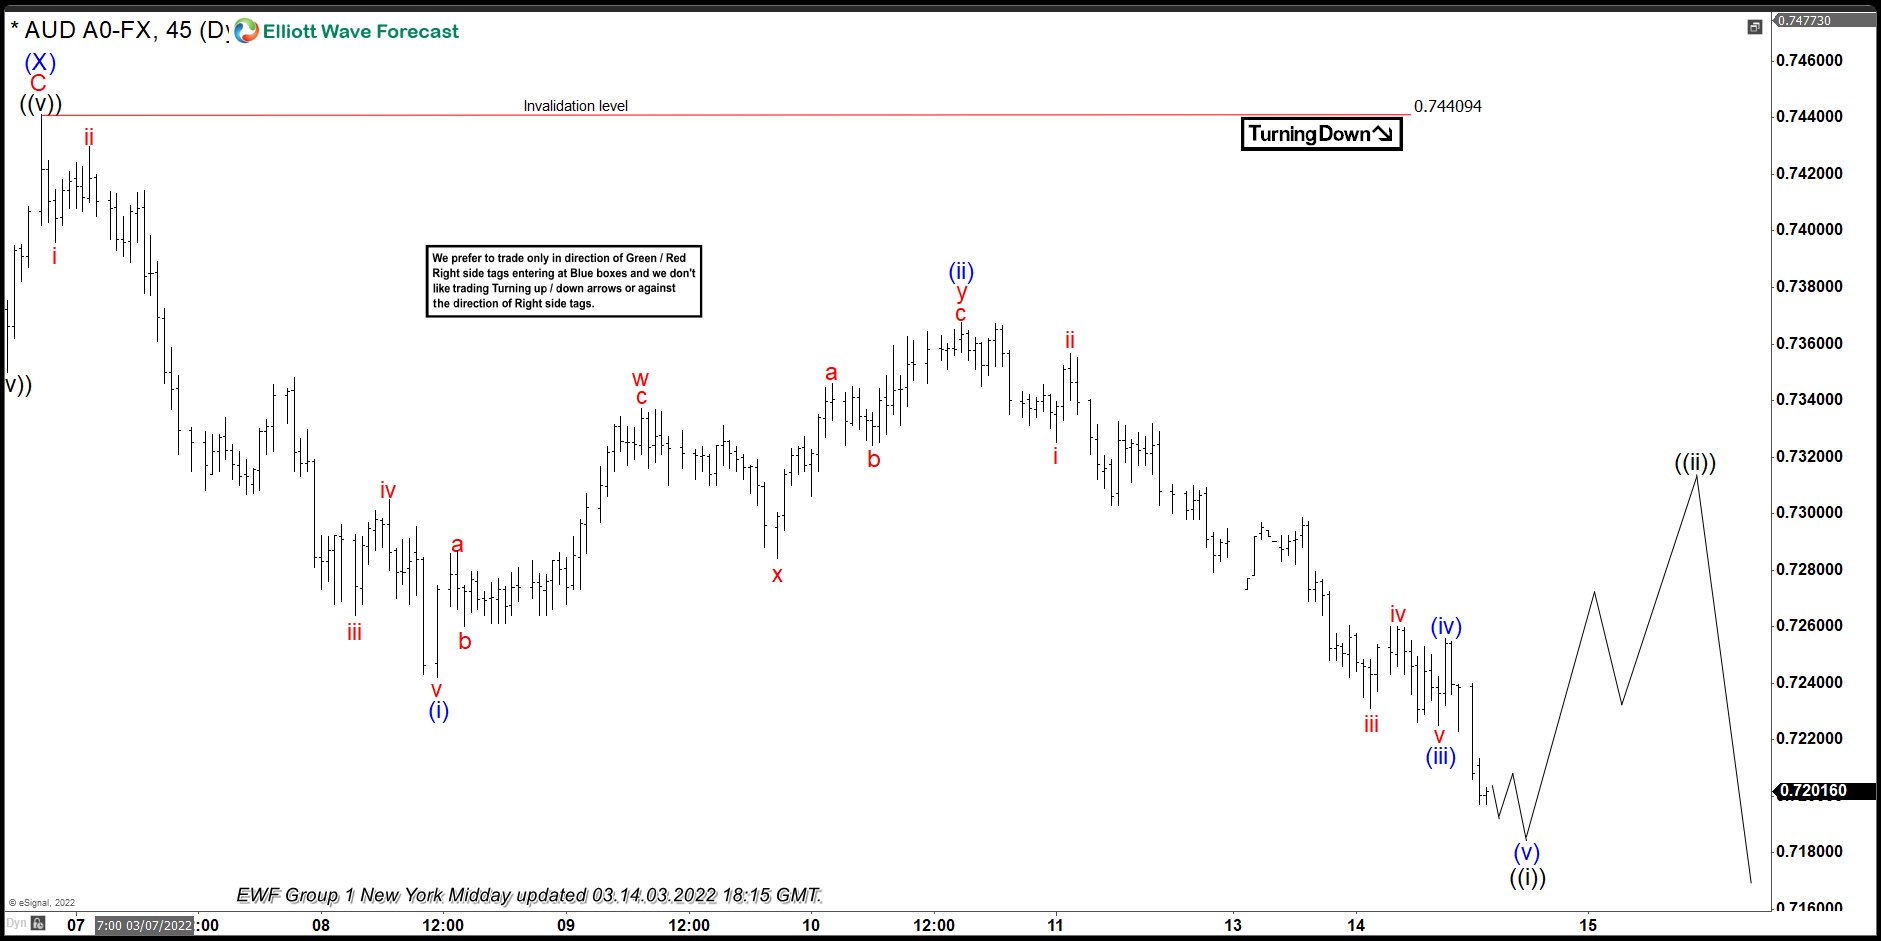
AUDUSD H1 Hour Elliott Wave Analysis 03.14.2022.
Eventually the pair made further separation down against the 0.7366 high and broke the previous low 03/08. We are approaching first target area at 0.7175-0.7129. At that zone sellers can be taking profits. So , proposed area can provide us with a 3 waves bounce before further drop continues.
Keep in mind that market is dynamic and presented view could have changed in the mean time. You can check most recent charts in the membership area of the site. Best instruments to trade are those having incomplete bullish or bearish swings sequences. We put them in Sequence Report and best among them are shown in the Live Trading Room.
Elliott Wave Forecast
Source: https://elliottwave-forecast.com/forex/audusd-elliott-wave-forecasting-path/