
After 1 year of muted and sideways movement, Gold looks to show some strength recently. Gold futures settled at $1900 an ounce for the first time since June last year. A threat of potential war between Russia and Ukraine might contribute to the recent strength. However, the main driver for the precious metal remains to be persistently high inflation. The Fed is widely expected to start raising the benchmark rate in the next March meeting to contain inflation. This should be the first among several benchmark rate raise this year.
Daily Chart of Gold (XAUUSD)
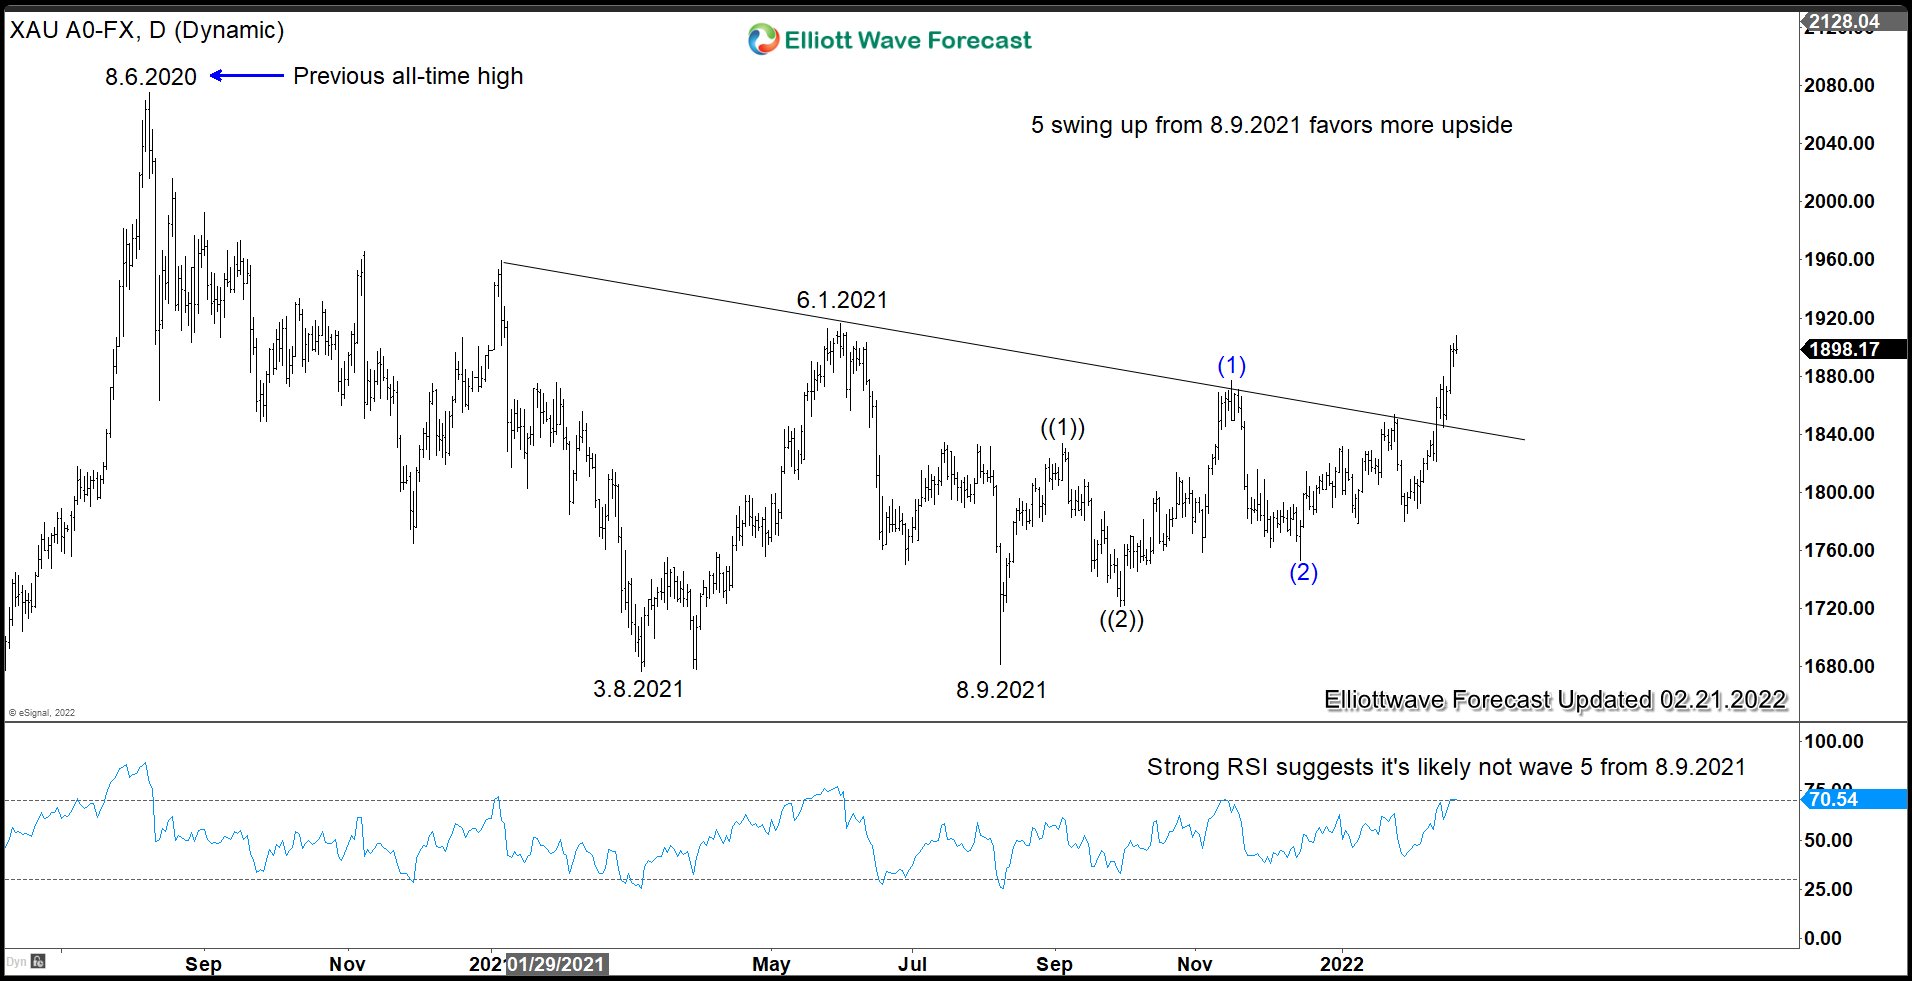
Daily Chart of Gold (XAUUSD) above shows a clear 5 swing from 8.9.2021 low. A 5 swing is an incomplete sequence, suggesting further upside to come. A break above 6.1.2021 high (1916.5) should further creates a higher high sequence from 3.8.2021 low favoring further upside. Momentum, as measured by RSI, also shows strength suggesting the previous metal is not likely within wave ((5)) from 8.9.2021 low. Wave ((5)) usually shows the lack of momentum (momentum divergence). We can conclude therefore that the move higher from 8.9.2021 low can be nesting ((1))-((2))-(1)-(2). This suggests pullback should continue to find support in 3, 7, or 11 swing against wave (2) low at 1753.10.
Gold in Yen (XAUJPY) Breaking to New All-Time High
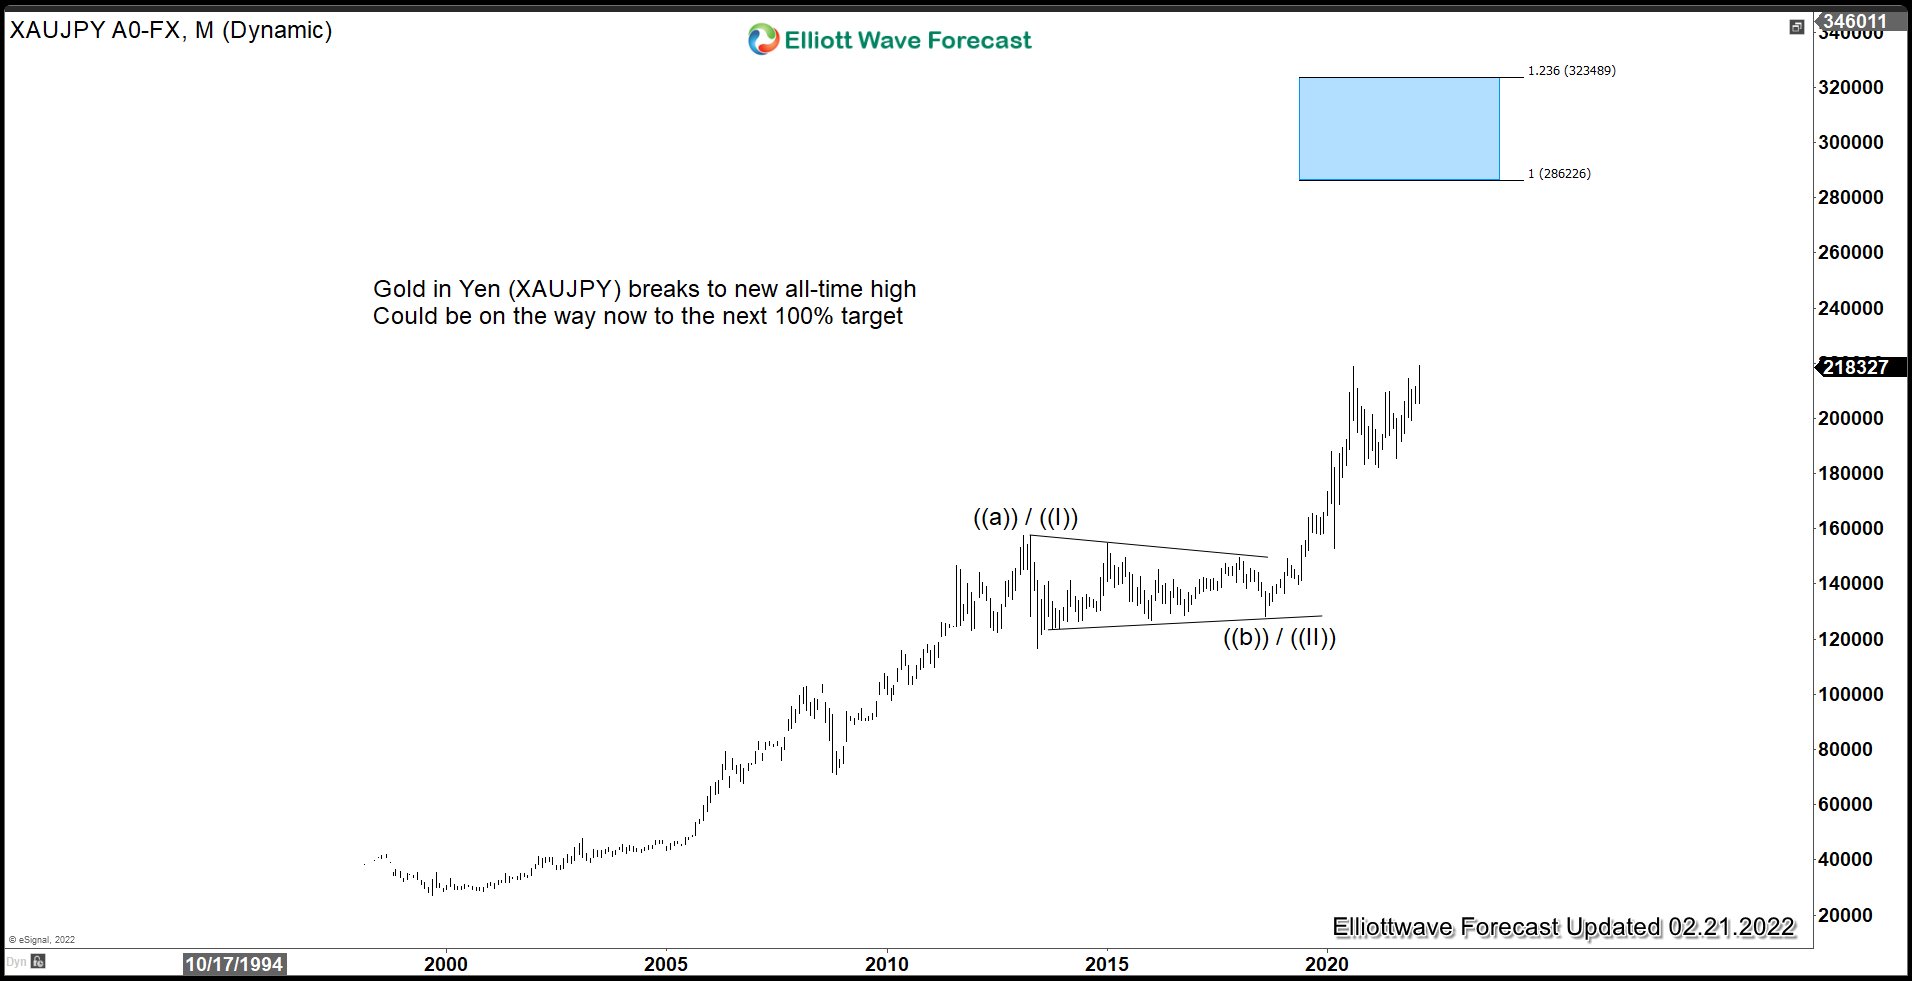
Gold in Yen terms (XAUJPY) broke to new all-time high last week. This is the first currency from G7 which has done so and most likely lead the other fiat currencies. As we can see from the monthly chart above, breaks to new high suggests the correction is over and it is ready to start a new bullish cycle higher. The potential target higher is the 100% extension area which comes at 286226 – 323489.
Source: https://elliottwave-forecast.com/commodities/threat-of-war-and-high-inflation-supporting-gold/