
$GLD ETF Long Term Cycles and Elliott Wave Analysis
Firstly the GLD ETF fund is one of the largest as well as one of the oldest Gold tracking funds out there since it’s inception date of November 18, 2004. From there on up into the September 2011 highs it ended a larger bullish cycle as did the Gold commodity in terms of US dollars. From the September 2011 highs the price decline was pretty steep however does appear corrective as a double three (a)-(b)-(c) (in blue color) into the December 2015 lows.
Secondly I would like to mention that the bounce from the December 2015 lows at 100.23 into the July 2016 wave I highs is clearly an Elliott Wave impulse. The bounce was strong enough to suggest it ended the cycle lower from the September 2011 highs as well thus at this point it is very much suspected to be resuming a long term bullish trend from the December 2015 lows. As shown above from there the metal made a wave (I) high in August 2020. From there it appears to be in a double three correction of the cycle up from the 2020 lows.
The analysis continues below the monthly chart.
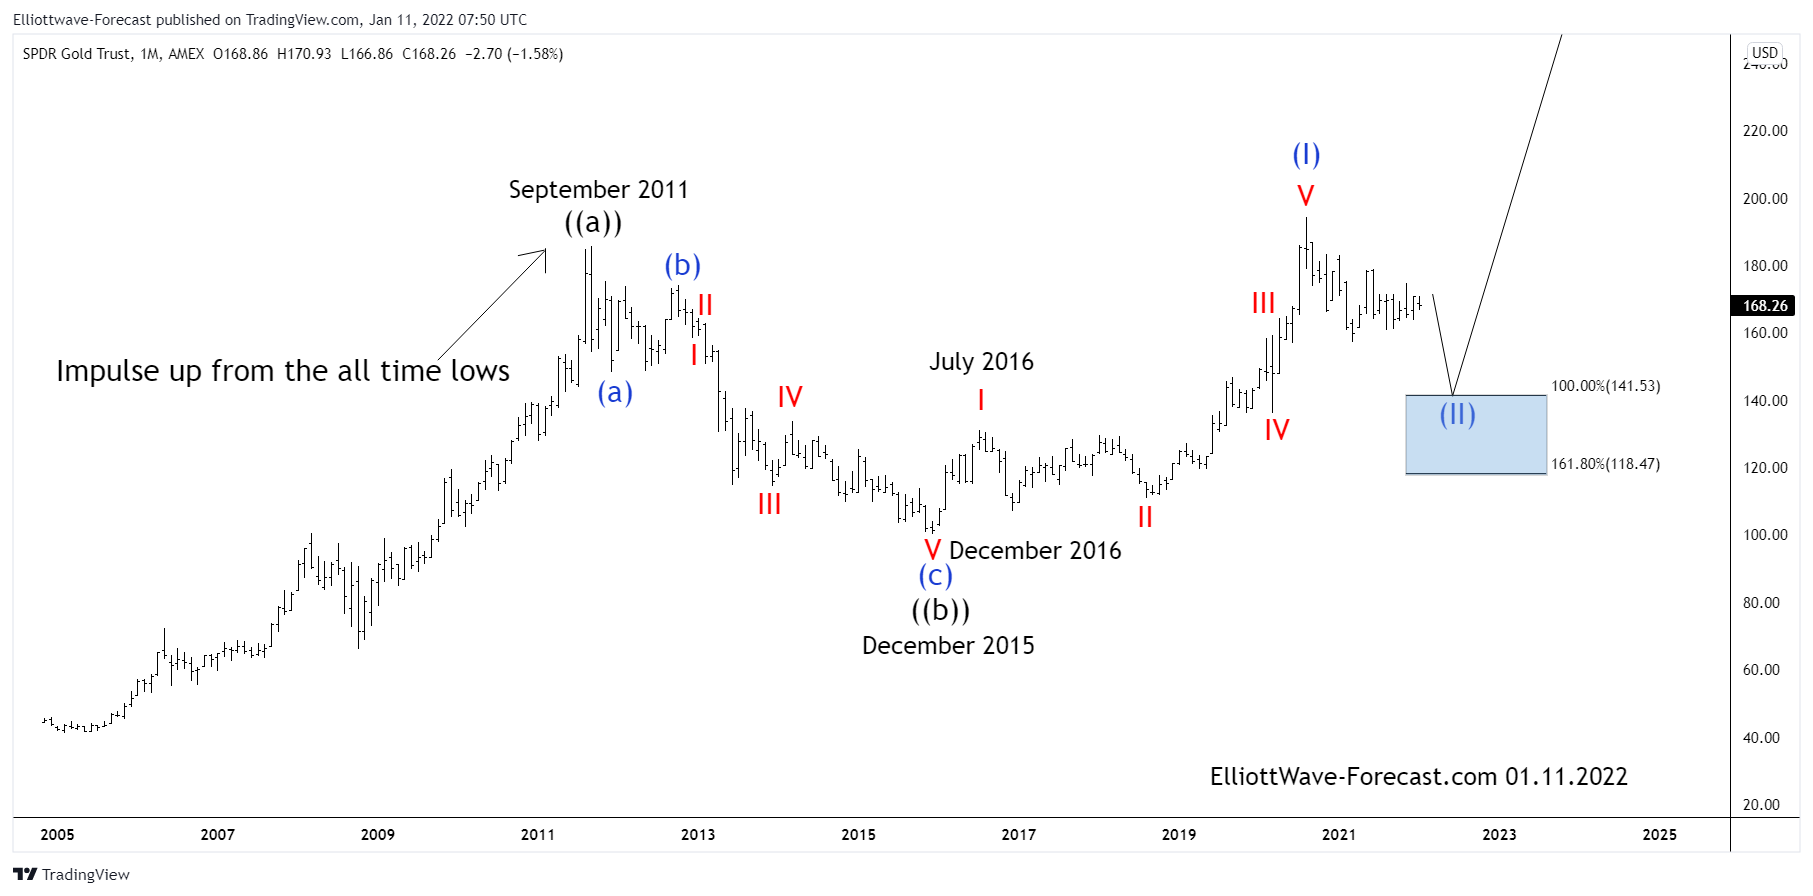
Thirdly in conclusion: The market moves in sequences of 5-9-13 swings in an impulse. It also moves in 3-7-11 swings when it corrects the prevailing trend. The bounce higher from the December 2015 lows appears to have a complete bullish sequence of five waves up. This bounce continued into the August 2020 highs. Currently the metal instrument appears that while below the June 2021 highs at 178.85 it can see weakness continue toward the 141.53 area before a turn back higher.
Source: https://elliottwave-forecast.com/stock-market/gld-etf-long-term-cycles-and-elliott-wave-analysis/