
Since the crash of March 2020, all stocks have tried to recover what they lost, and Disney was no exception. Disney did not only recover the lost, but It also reached historic highs. Now, we are going to try to build an impulse from the March 2020 lows with a target around $230. Target measured from 0 to 2019’s high projected from March’s low, equal legs. Since we begin with this analysis on February 13th, we bought the share in 160.97 then the market broke to a new historical high and reached the first target at 190.88 after hours. The target gave us a return of +18.58% in 12 days.
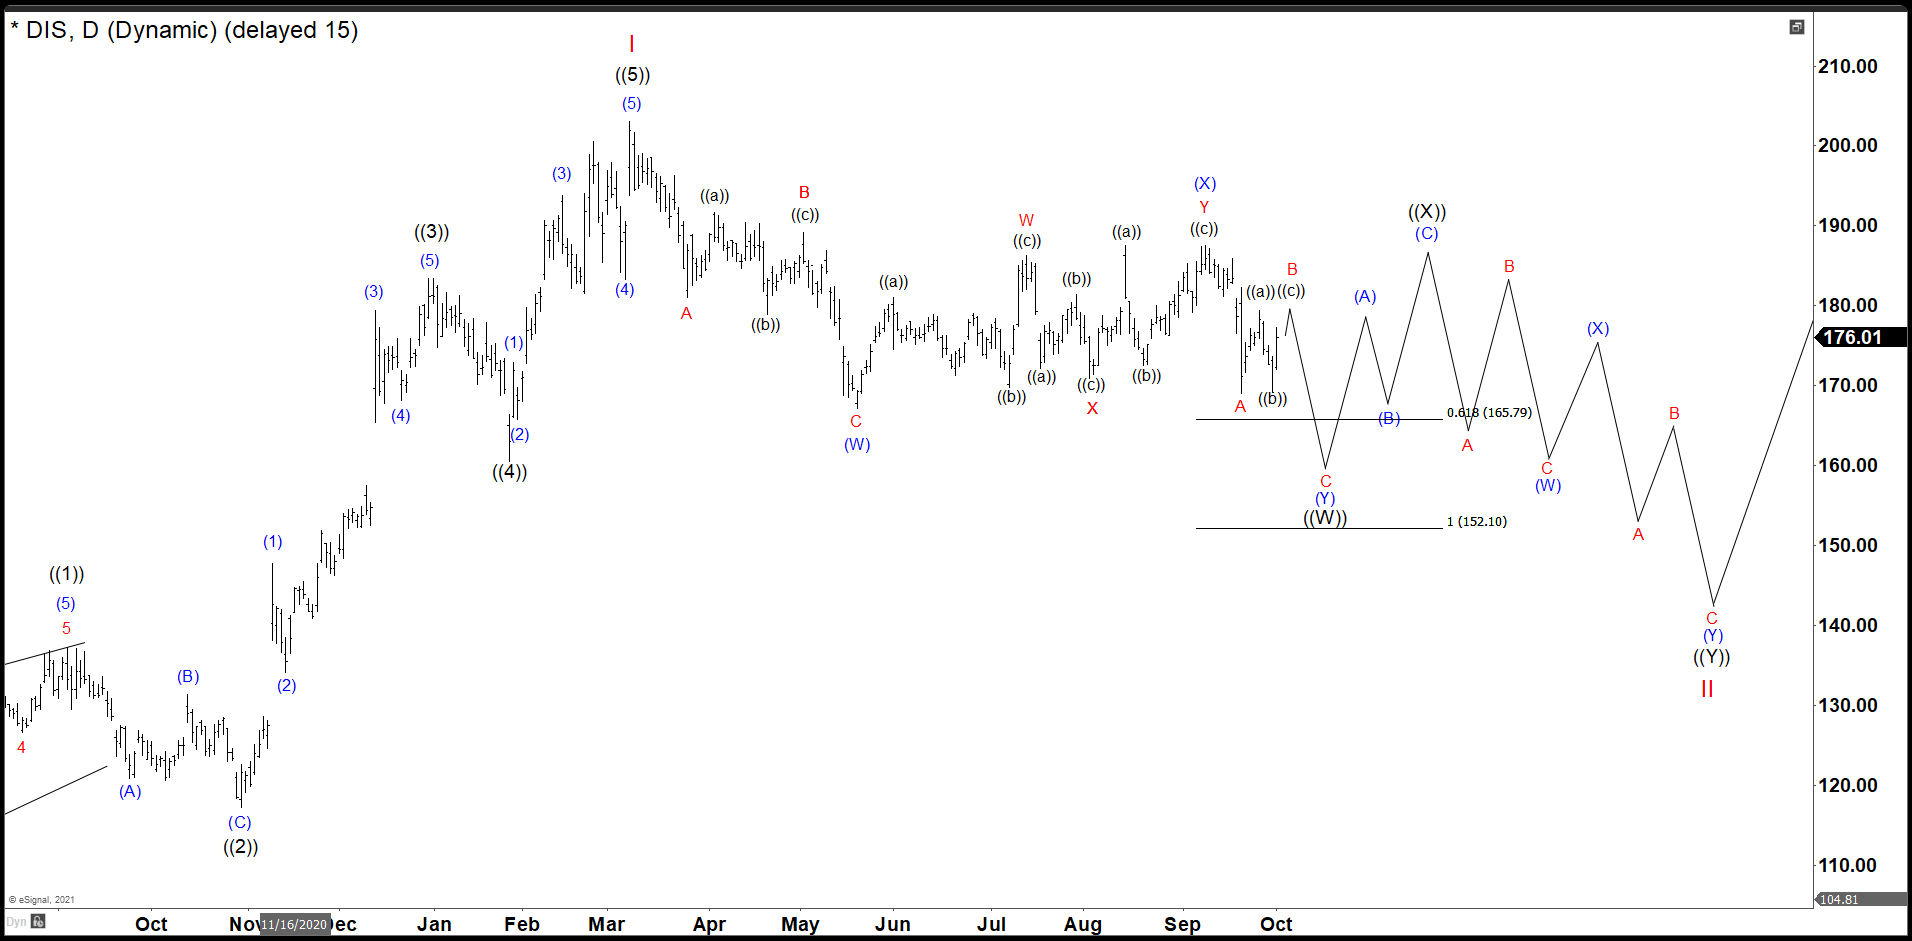
Disney October Daily Chart
We relabeled Disney impulse building a leading diagonal from March 2020 low ending at 137.34 as wave ((1)). Then a zig zag correction as wave ((2)) finishing at 117.19. Wave ((3)) is a clearly impulse ended at 183.54 and wave ((4)) pullback ended at 160.57. The last push to the upside to complete wave ((5)) and Wave I topped at 203.01. From there, the stock did 3 swings down gave us the idea that we need one more rally to complete the impulse to $230.00 target, but the lagging in time from last months were too long to think about that rally and it was better to think that we were already in wave II correction.
Disney November Daily Chart
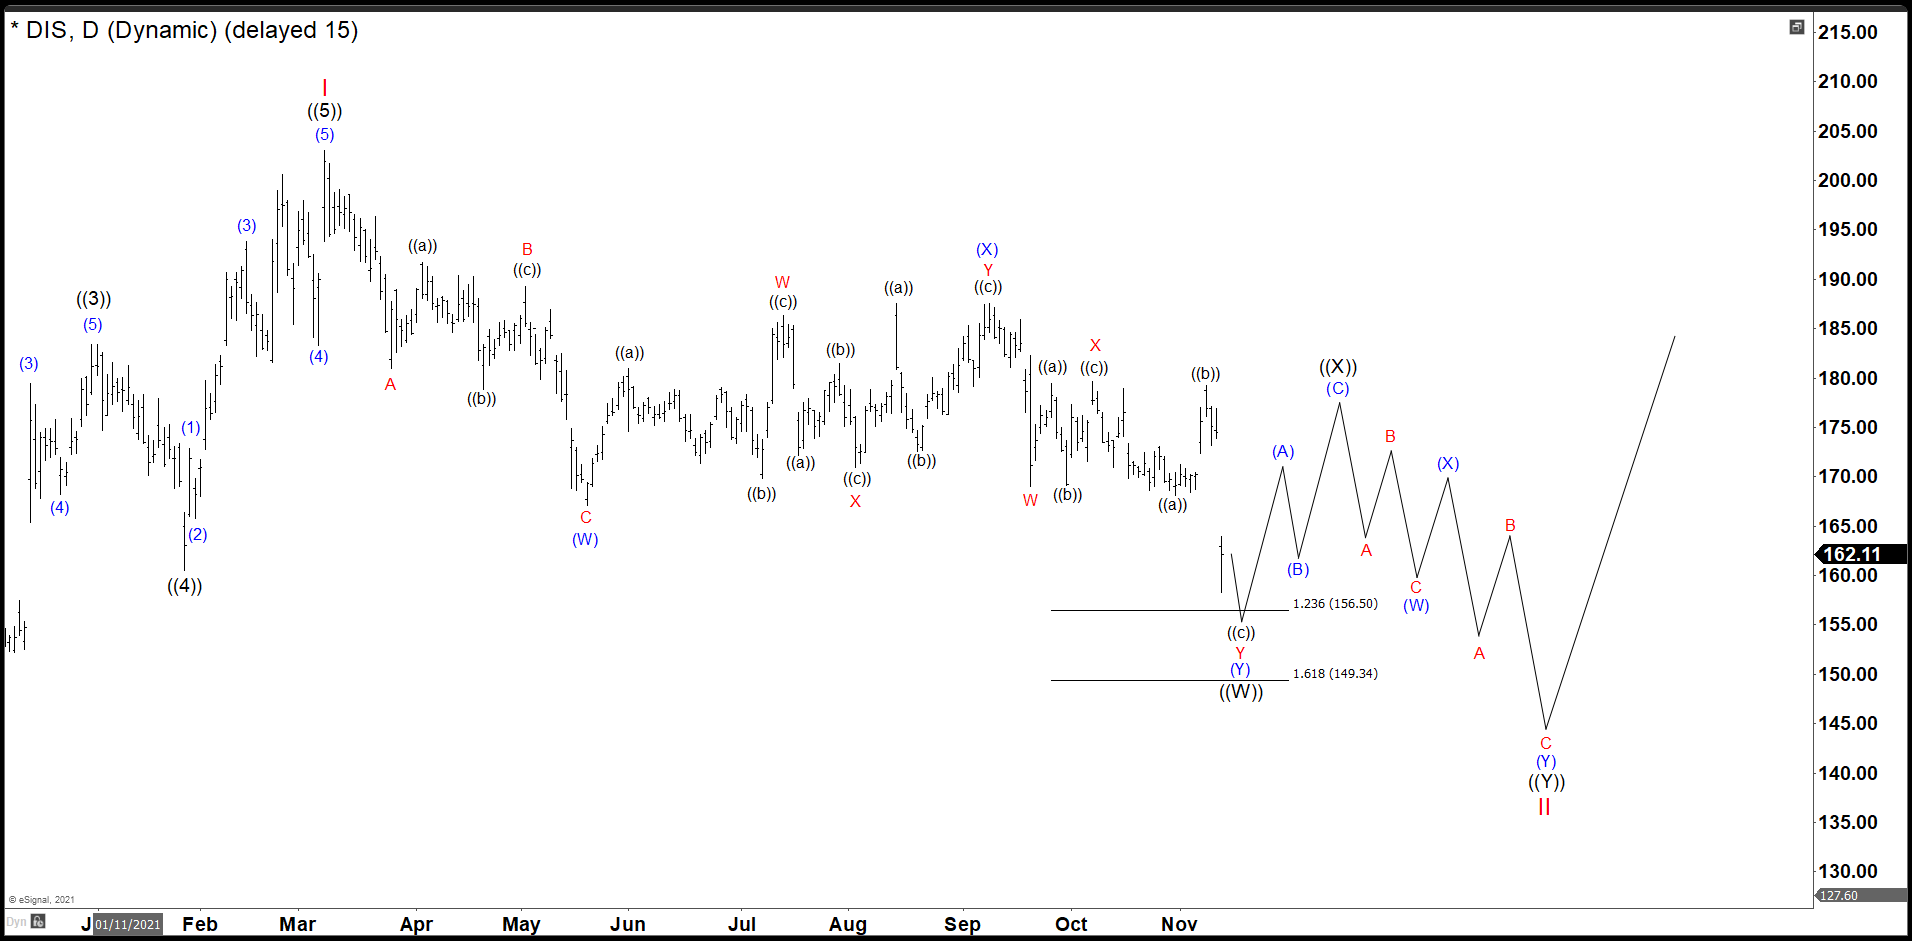
Therefore, Disney stock began to build a double correction. Down from the peak 3 swings completed wave (W) at 167.10. Then, we had 7 swings higher to complete wave (X) at 187.58 and we were looking 3 swings more to complete wave (Y) and the first leg of ((W)) in 156.50 – 149.34 area. (If you want to learn more about Elliott Wave Theory, please follow these links: Elliott Wave Education and Elliott Wave Theory).
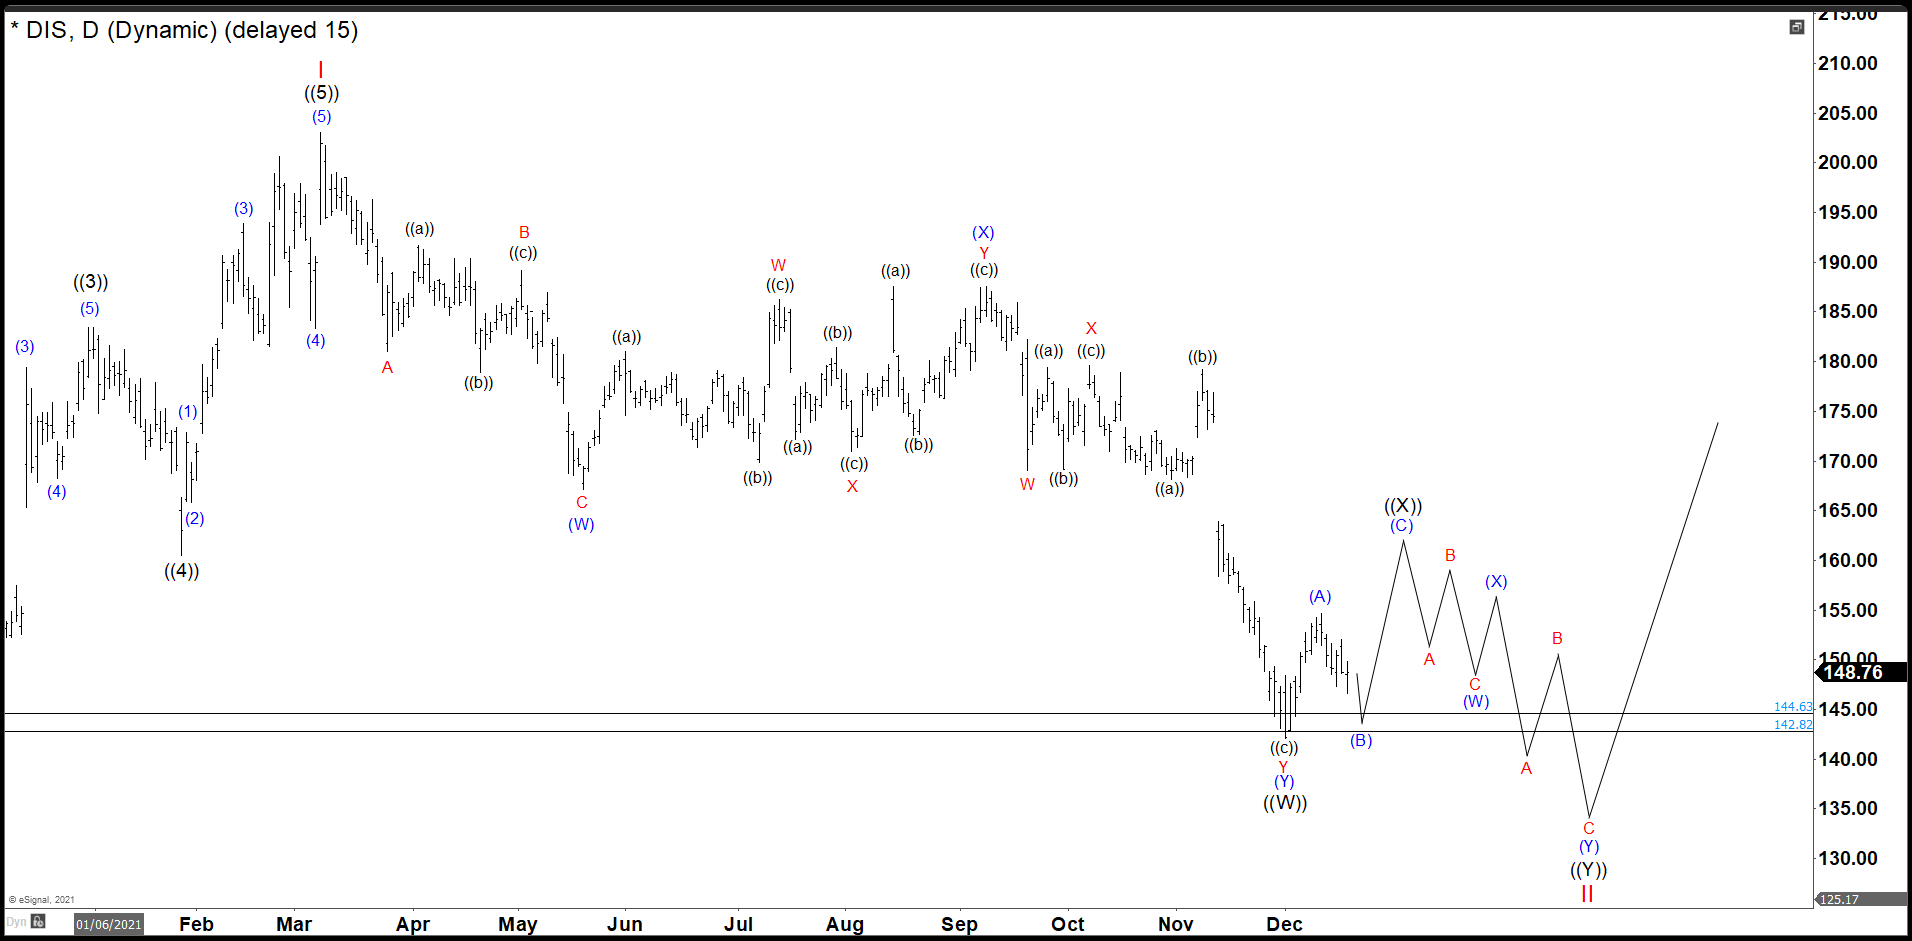
Disney December Daily Chart
Market continued dropping and Disney found support at 142.04 where we believe wave (Y) and wave ((W)) finished. Then we should bounce in 3 swings that should fail to complete the connector ((X)) and further downside should take place. Wave (A) of ((X)) ended at 154.66 and we are looking a correction as wave (B) to end in 142.82 – 144.63 and see a last rally to complete (C) of ((X)).
The last phase should have the same structure of the first one, that is a double correction (W), (X), (Y) to complete wave ((Y)) and also wave II. We will look to buy when wave II is done.
Source: https://elliottwave-forecast.com/stock-market/disney-connetor-is-on-its-way/