
In this technical blog we’re going to take a look at the Elliott Wave charts charts of NIFTY index published in members area of the website. Recently the Index corrected the cycle from the 18600 ( October ) peak. Recovery unfolded as Elliott Wave Flat structure. Once target area was reached, the index found sellers as expected and we got turn lower. In further text we’re going to explain the forecast and Elliott Wave Pattern.
Before we take a look at the real market example of Expanded Flat, let’s explain the pattern in a few words.
Elliott Wave Expanded Flat Theory
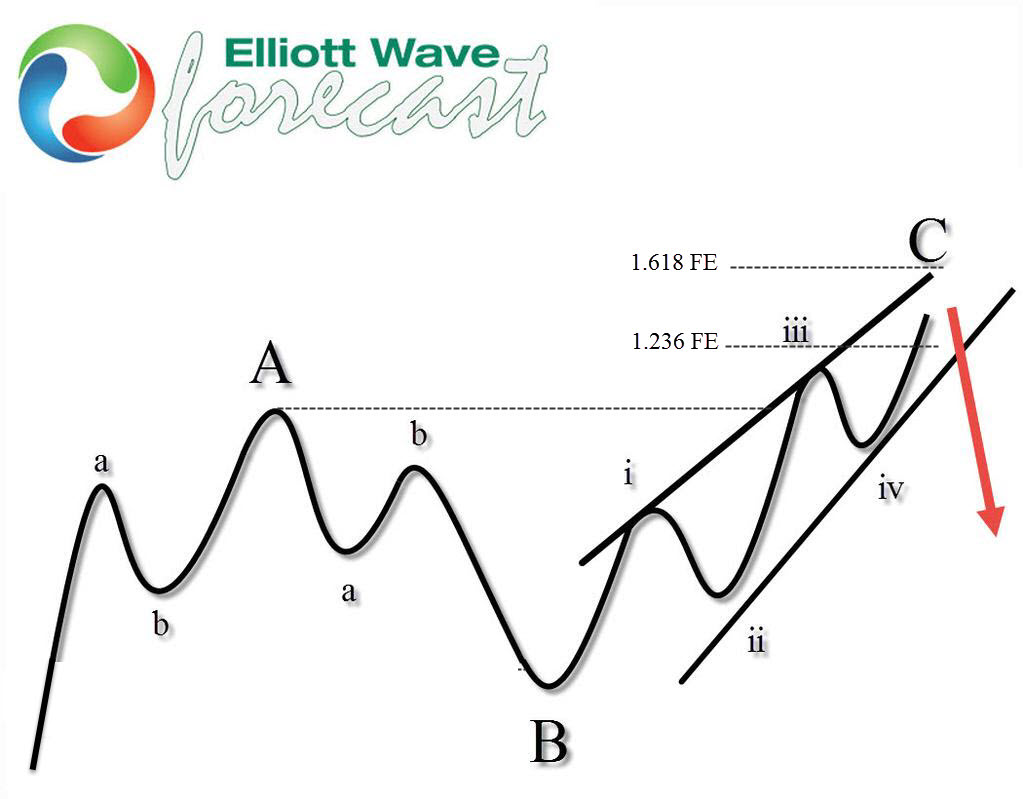
Elliott Wave Flat is a 3 wave corrective pattern which could often be seen in the market nowadays. Inner subdivision is labeled as A,B,C , with inner 3,3,5 structure. Waves A and B have forms of corrective structures like zigzag, flat, double three or triple three. Third wave C is always 5 waves structure, either motive impulse or ending diagonal pattern. It’s important to notice that in Flat Pattern wave B is very deep, but completes above the start point of wave A. Wave C ends above the ending point of wave A . Wave C of Flat completes usually between 1.00 to 1.236 Fibonacci extension of A related to B, but sometimes it could go up to 1.618 fibs ext.
At the graphic below, we can see what Expanded Flat structure looks like
Now, let’s take a look what Elliott Wave Flat Pattern looks like in the real market
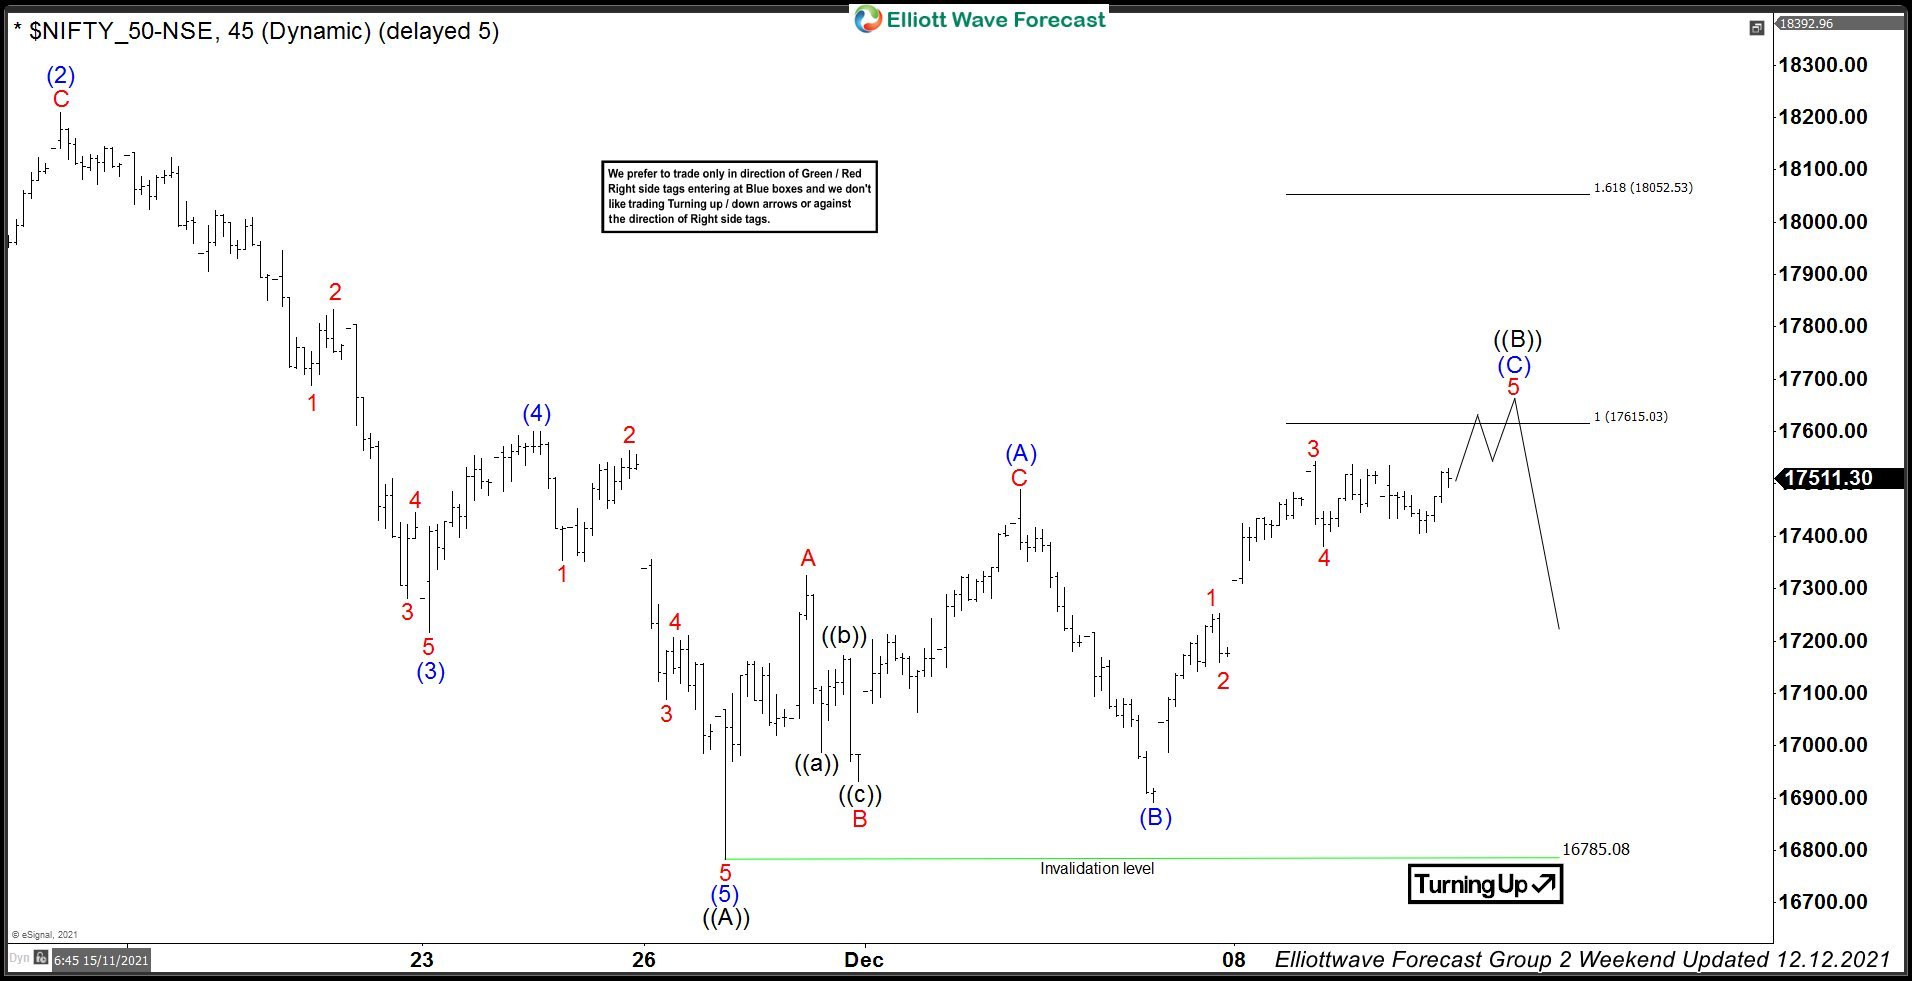
NIFTY 1 Hour Elliott Wave Analysis 12.12.2021.
NIFTY is giving us correction of the cycle from the October peak. Wave ((B)) correction looks to be unfolding as Elliott Wave Flat Pattern and still look incomplete at the moment. Waves (A) and (B) are showing corrective sequences. At this stage we expect to see more short term strength to complete 5 waves up from the recent low which would be (C) leg of ((B)) black Flat recovery. Another leg up should ideally see 17615.03-18052.5 area before sellers appear again for proposed decline toward new lows ideally.
You can learn more about Elliott Wave FLAT Patterns at our Free Elliott Wave Educational Web Page
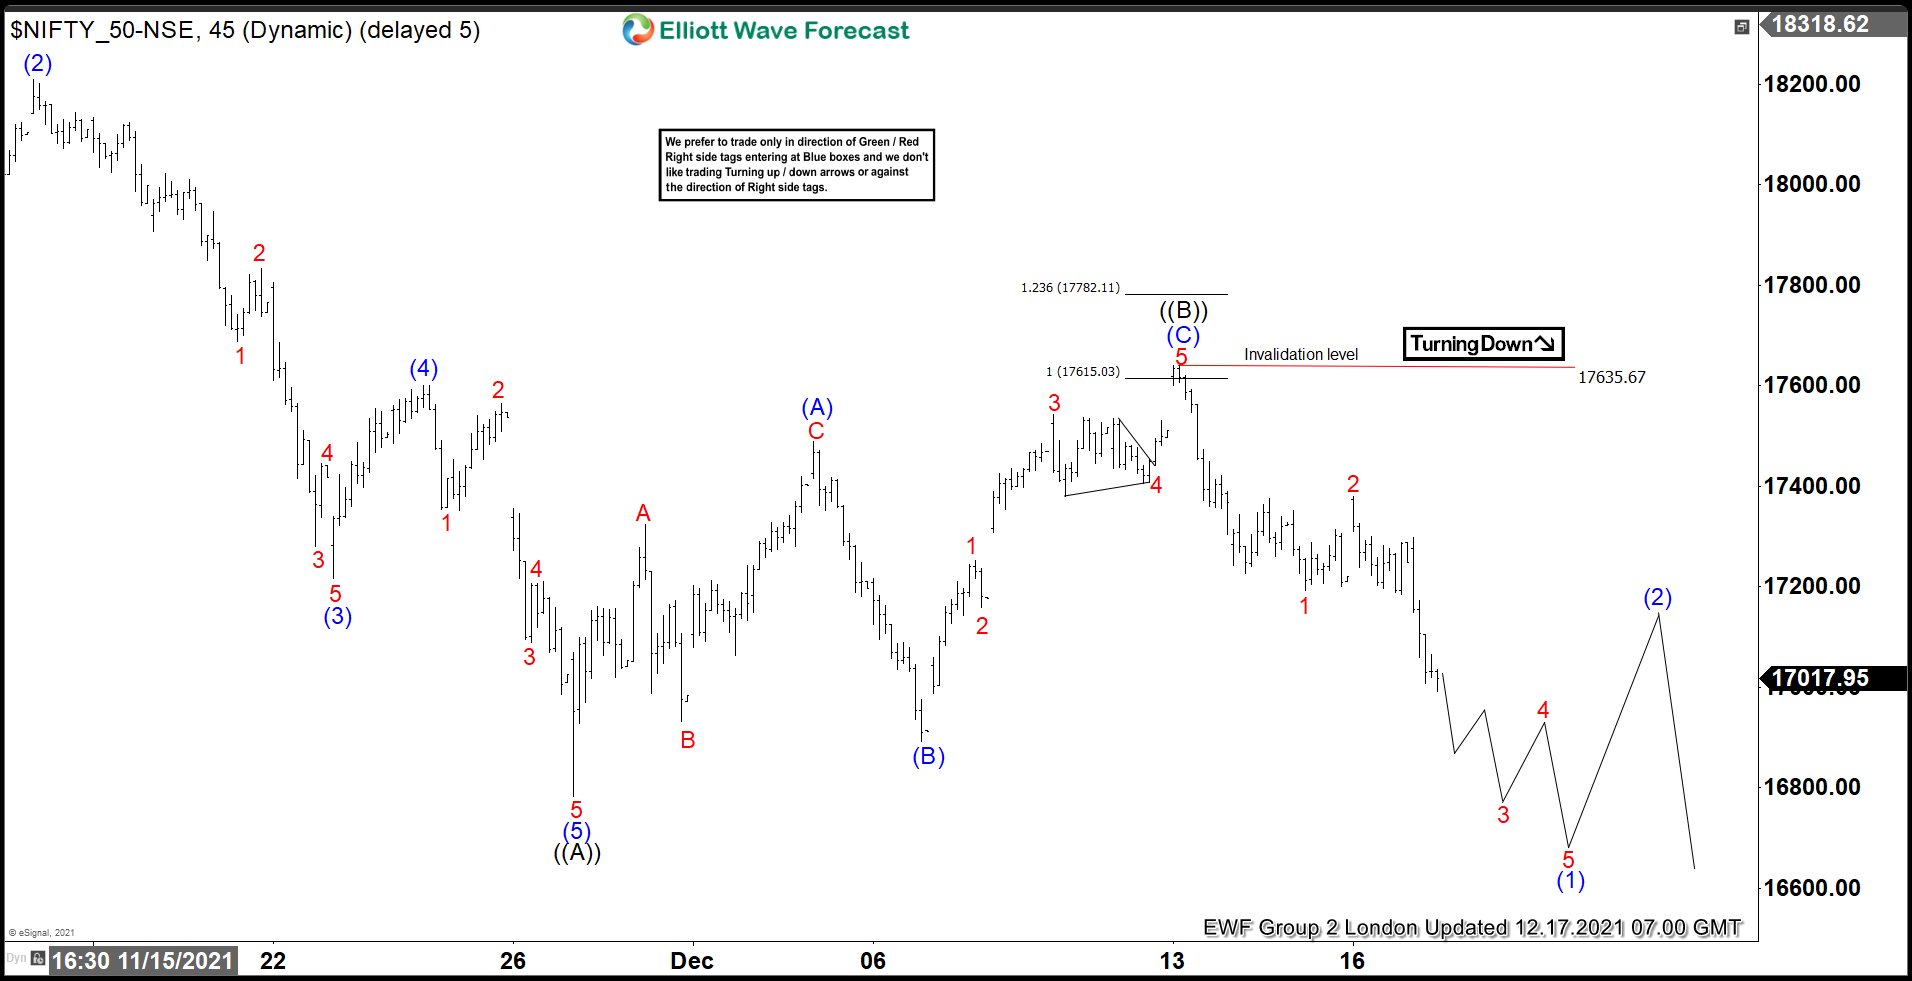
NIFTY 1 Hour Elliott Wave Analysis 12.17.2021.
Recovery made another leg up toward 17615 area and completed 5 waves in (C) leg as we expected. NIFTY completed Elliott Wave Flat Structure at 17635.6 high. As far as the price stays below that high, NIFTY can be giving us next leg down. We would like to see break of 11/29 low which will confirm next leg down is in progress.
Keep in mind that market is dynamic and presented view could have changed in the mean time. You can check most recent charts in the membership area of the site. Best instruments to trade are those having incomplete bullish or bearish swings sequences. We put them in Sequence Report and best among them are shown in the Live Trading Room.
Elliott Wave Forecast
Source: https://elliottwave-forecast.com/elliottwave/nifty-index-sellers-elliott-wave-flat/