
Gold and related Index such as Gold Miners Junior (GDXJ) have been in steady decline / sideways in the past 14 months. GDXJ in particular continues to correct lower after forming the high at 65.95 on August 2020. In this article, we will take a look at the potential support area for the ETF. We believe the longer term direction of this ETF still remains higher despite the more than 1 year correction.
GDXJ Monthly Elliott Wave Chart
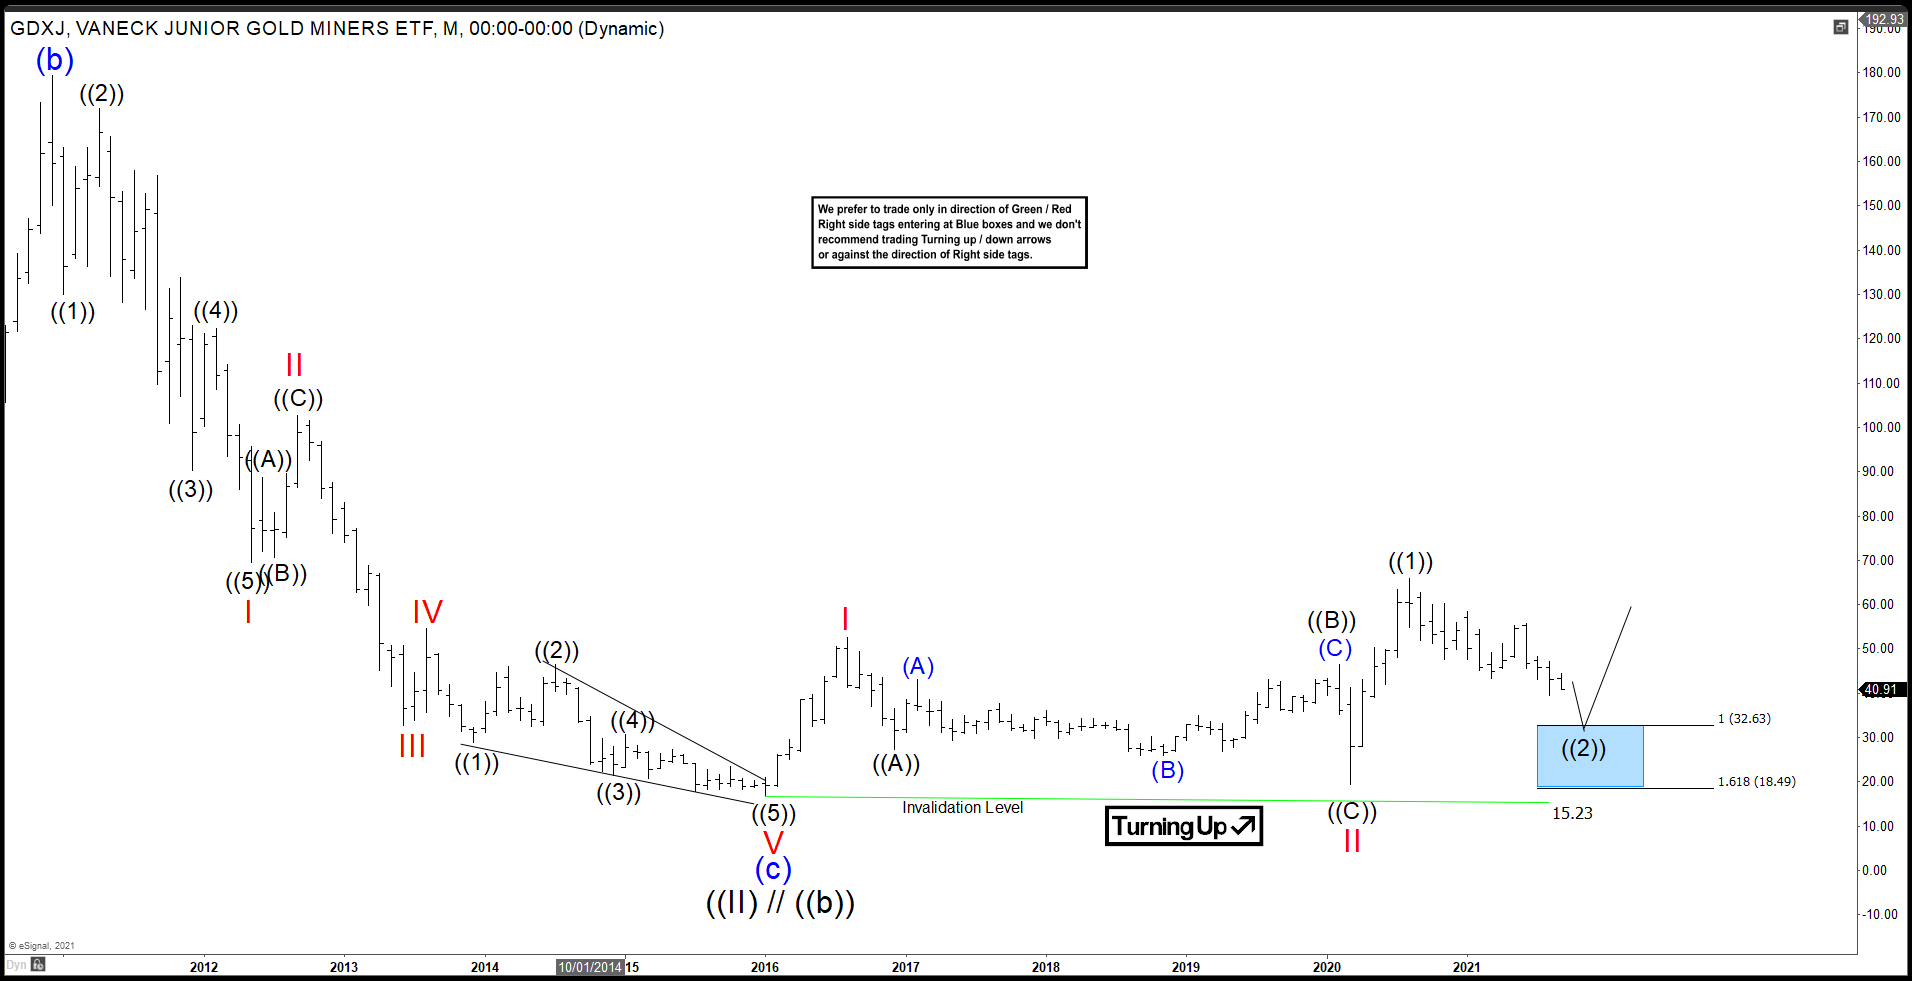
Monthly chart of GDXJ above suggests decline to $15.23 ended Grand Super Cycle wave ((II))/((b)) on January 2016. The ETF starts to turn higher and likely in the very early stage of the next multi-year / decade bull run. Wave ((2)) of III pullback is currently in progress to correct cycle from March 2020 low. As far as pullback stay above $15.23, expect the ETF to resume higher again.
GDXJ Daily Elliott Wave Chart
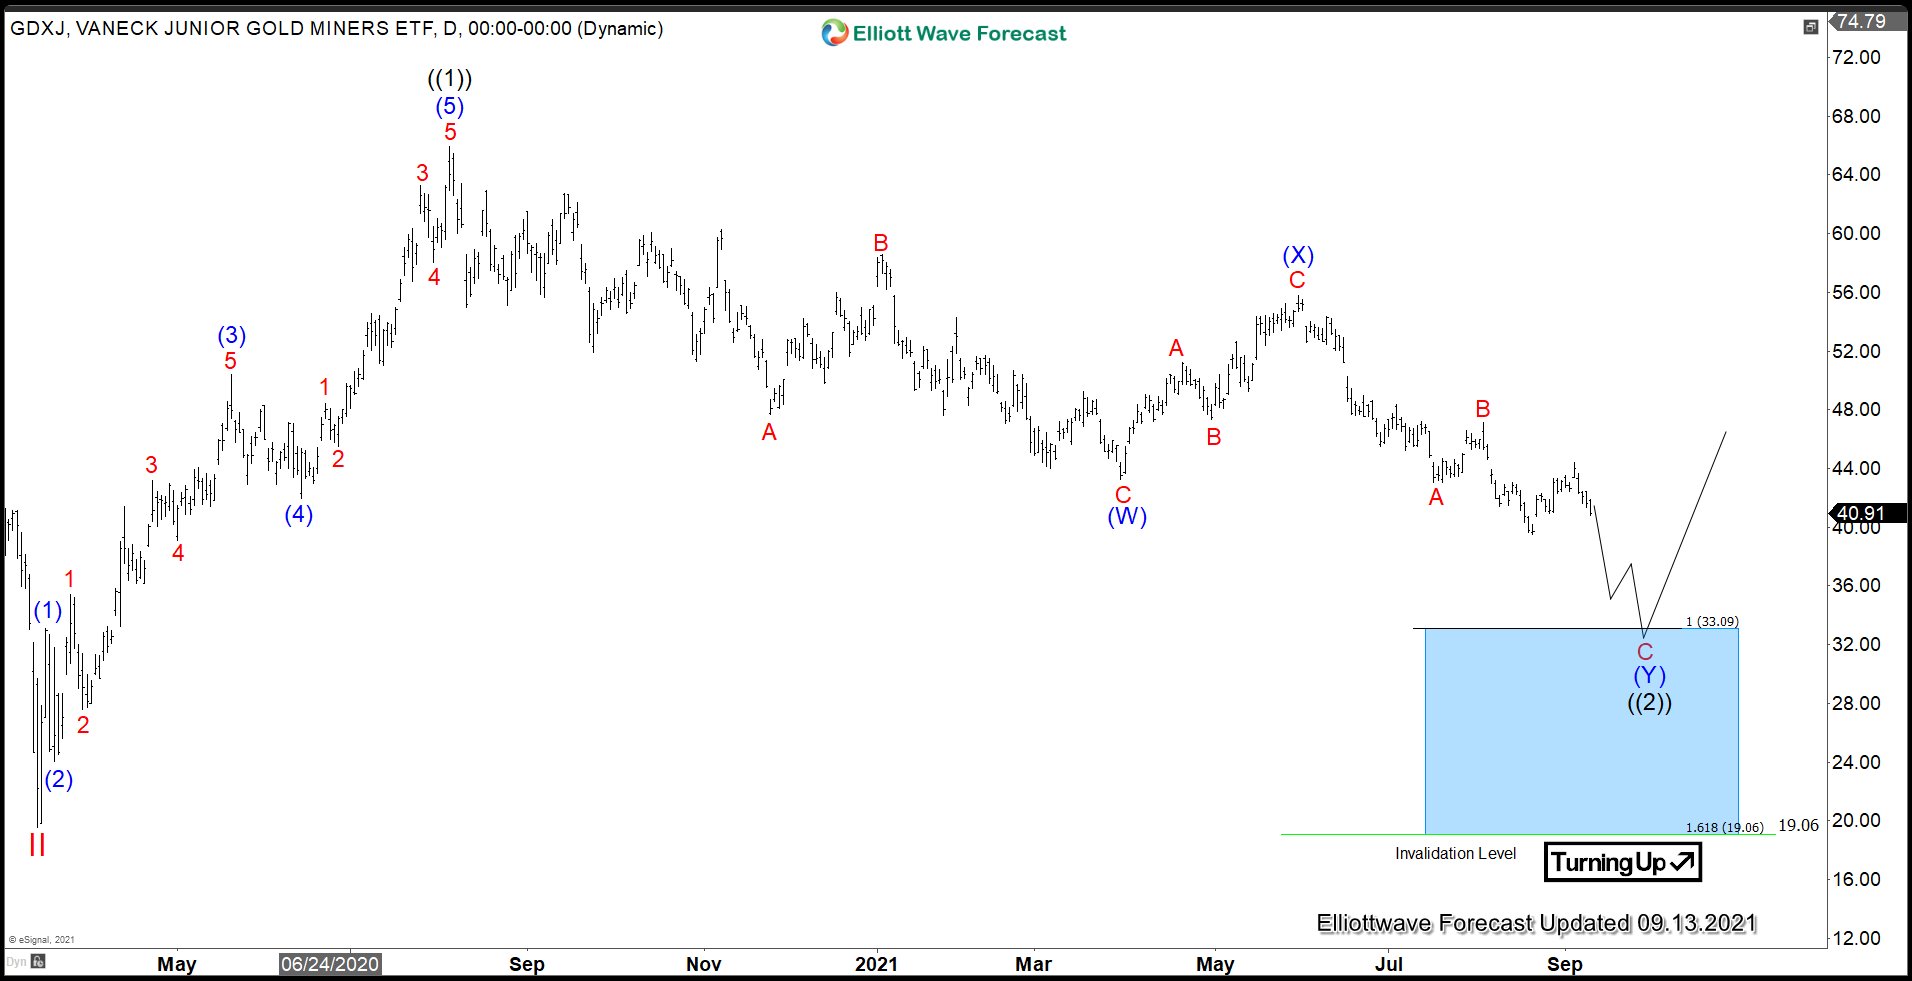
Daily chart of GDXJ above shows rally to 65.95 ended wave ((1)) as an impulse. Wave ((2)) pullback is currently in progress as a double three Elliott Wave structure. Down from wave ((1)), wave A ended at 47.68 and wave B ended at 58.55. The ETF then resumes lower in wave C towards 43.24 which also completed wave (W). Wave (X) rally ended at 55.79 as a zigzag structure. Final leg lower wave (Y) of ((2)) could see a little more downside to reach 100% – 161.8% of wave (W) towards 19.06 From this area, the ETF could turn and start the next leg higher.
Source: https://elliottwave-forecast.com/stock-market/potential-support-turn-higher-gdxj/