Since the crash of March 2020, all stocks have tried to recover what they lost and JNJ was no exception. Johnson & Johnson did not only recover the lost, but it also reached historic highs. In those days, we were looking as a first entry in 155.33 – 156.93 area to reach a target above $176 and a few days ago we achieved the minimum target at $178.97.
JNJ April Daily Chart
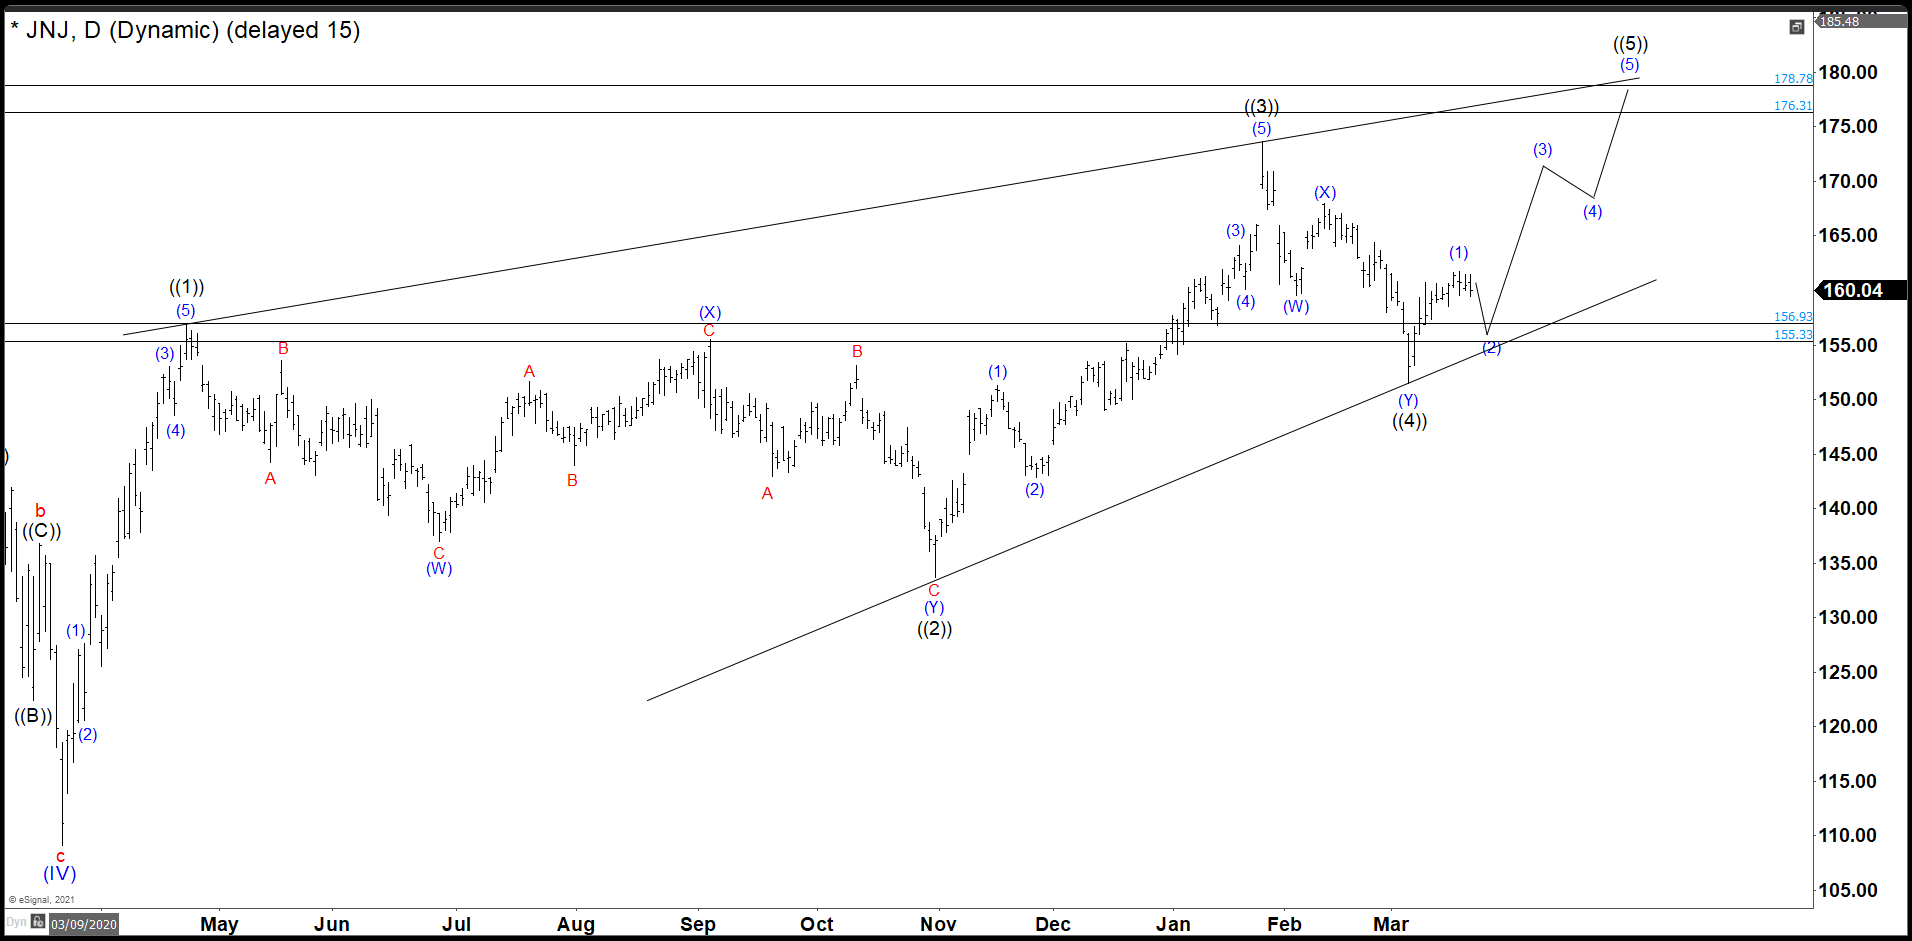
In April old chart, we can clearly see that after the fall of March 2020, JNJ had a strong and rapid recovery in 3 swings. The wave ((3)) had its highest point at 173.69 where market rejected. This rejection did another double correction structure and overlaps the wave ((1)) zone to end the wave ((4)) and from here it should continue higher to complete wave ((5)) as a diagonal. (If you want to learn more about Elliott Wave Theory, please follow this link: Elliott Wave Theory).
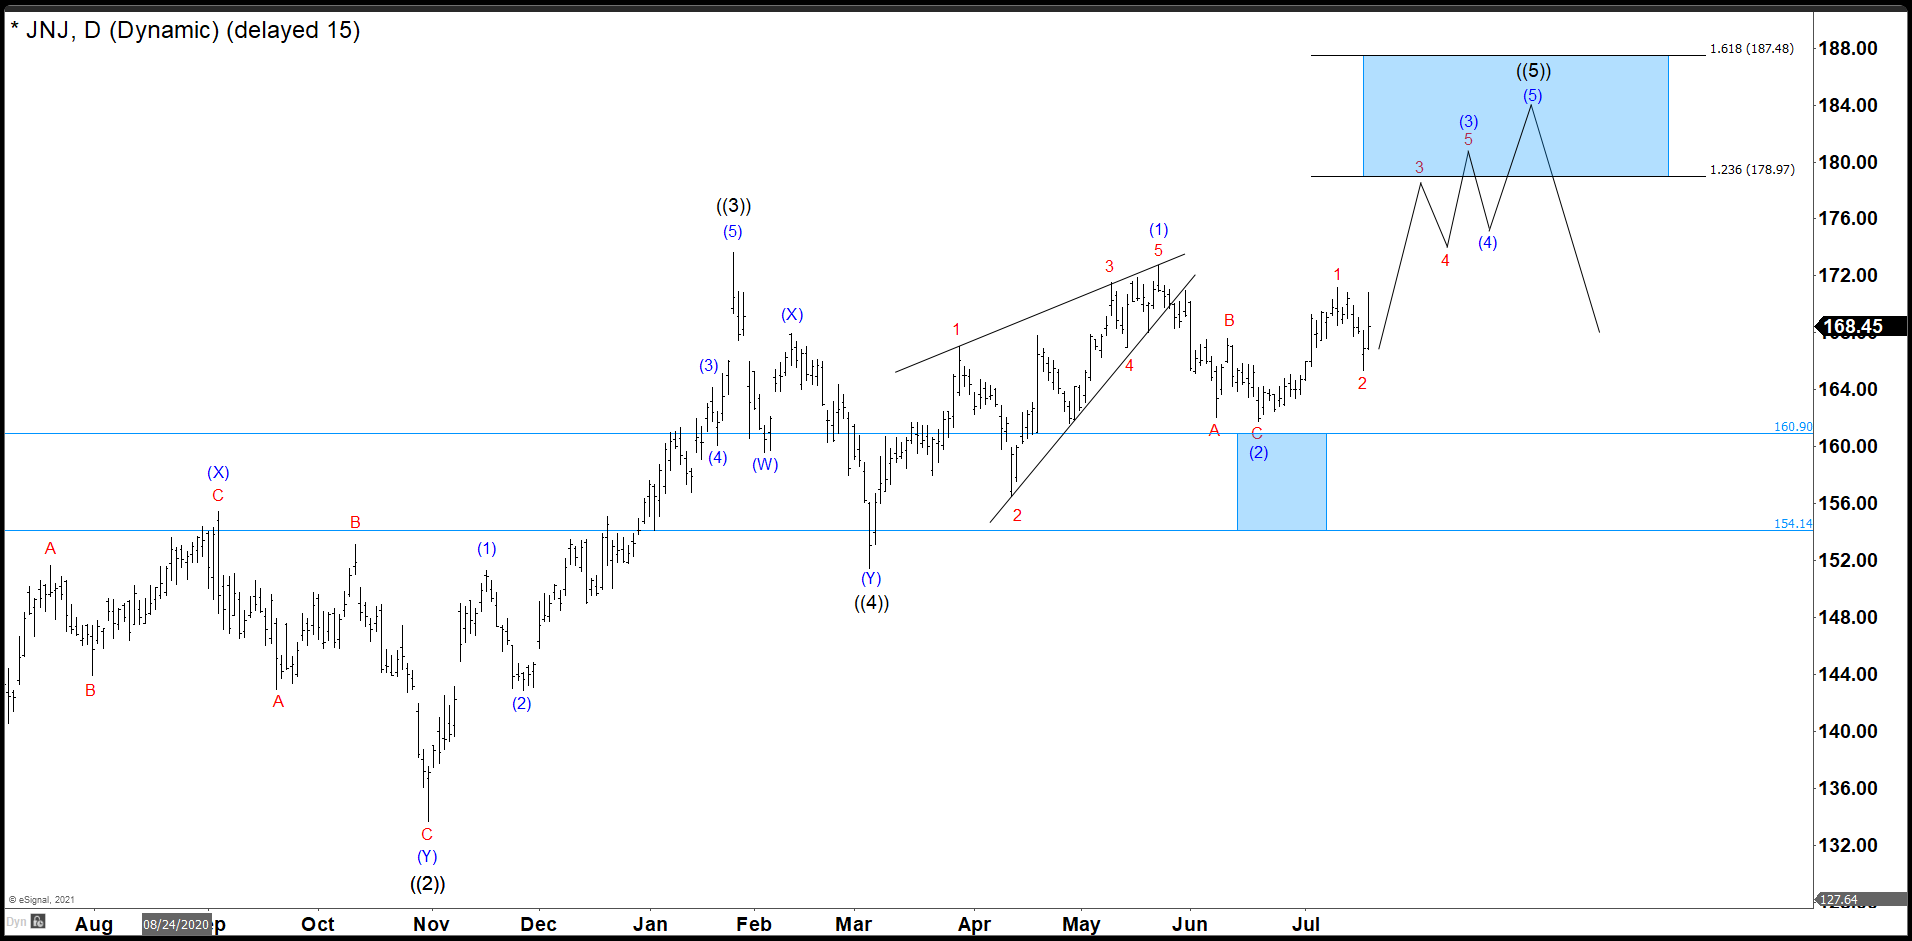
JNJ July Daily Chart
The share price continued to rise until reaching 172.79, we call wave (1) and you can see the structure is a Leading Diagonal (LD). Besides in April, wave 2 in red drop to our minimum entry at 156.93 and bounce to complete the LD. From there, we have a clear correction as a zig zag wave (2) missing our ideal second entry for a few cents and the possible target to complete wave ((5)) came in 178.97 – 187.48 area.
JNJ Daily Chart
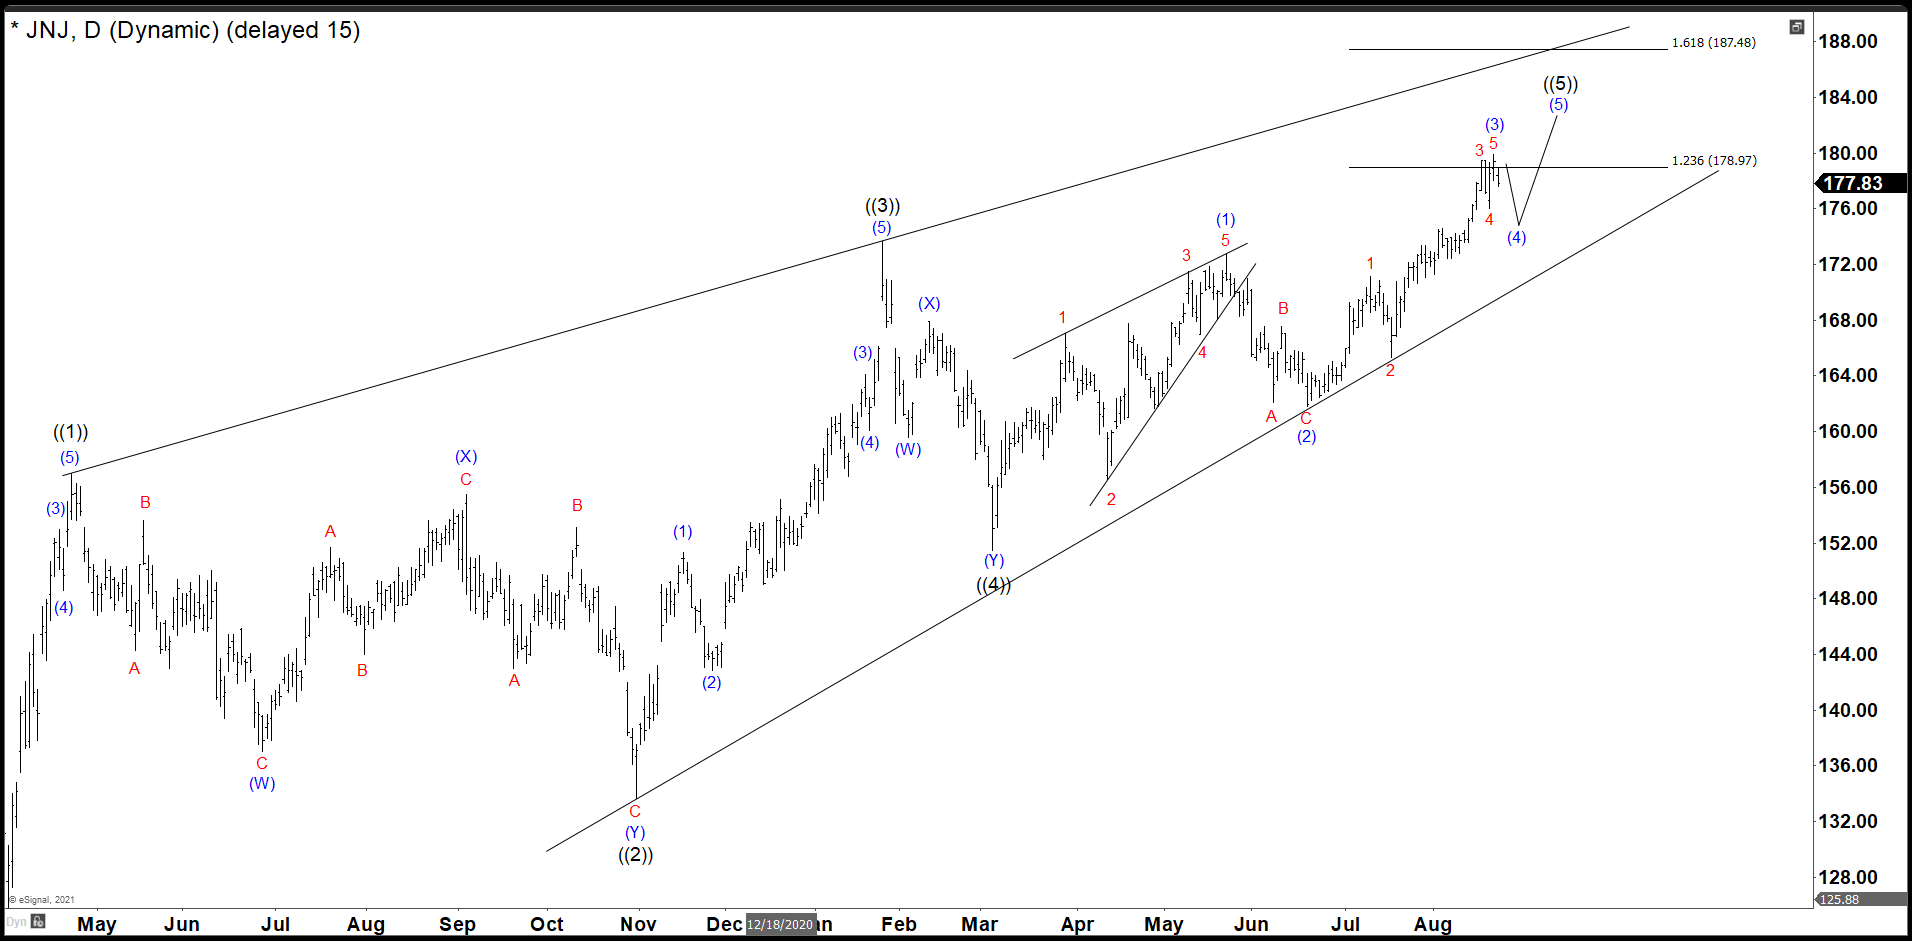
We are calling wave (3) of ((5)) at 179.92. That means our 178.97 minimun target was achieved from 156.93 give us a 14.04% return. Actually, we are expecting a pullback as wave (4) and then a last push above 179.92 to complete wave (5) and also the wave ((5)) of the big ending diagonal. This is the principal view and we need a little more run of the market to determinate some new alternatives that could happen with JNJ from here.
Source: https://elliottwave-forecast.com/stock-market/jnj-achieved-target-14-04-return/