
Hello fellow traders. In this technical blog we’re going to take a quick look at the Elliott Wave charts of NIKKEI published in members area of the Elliottwave-Forecast . As our members know, NIKKEI is showing lower low sequences in the cycle from the February 16th peak. Recently we got recovery that has unfolded as Elliott Wave Double Three pattern that has given us opportunity to enter short trades. In further text we’re going to explain the forecast and Elliott Wave Pattern and trading strategy.
Before we take a look at the real market example, let’s explain Elliott Wave Double Three pattern.
Elliott Wave Double Three Pattern
Double three is the common pattern in the market , also known as 7 swing structure. It’s a reliable pattern which is giving us good trading entries with clearly defined invalidation levels.
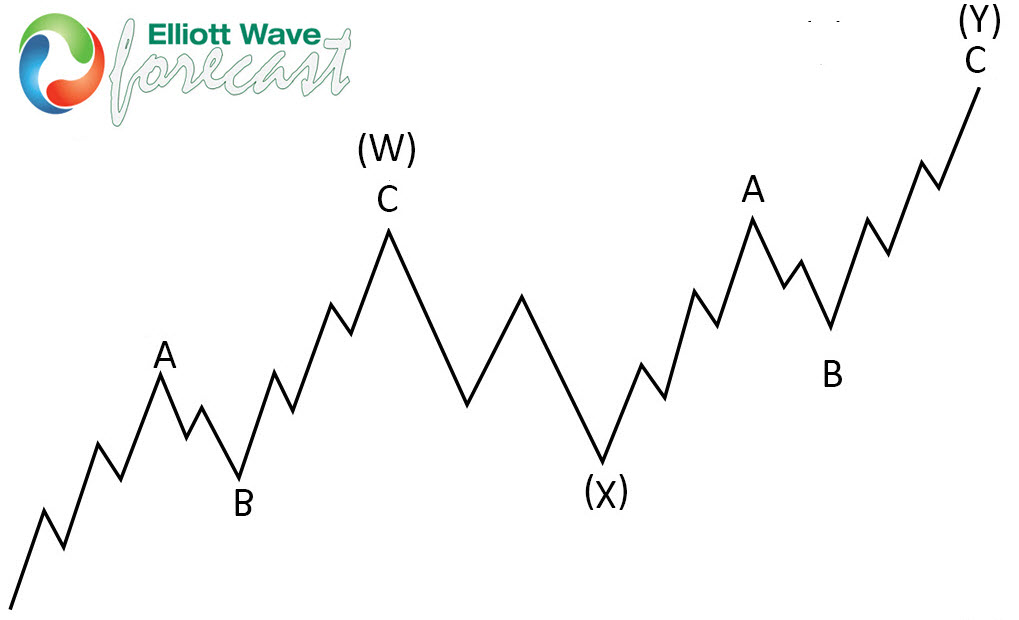
The picture below presents what Elliott Wave Double Three pattern looks like. It has (W),(X),(Y) labeling and 3,3,3 inner structure, which means all of these 3 legs are corrective sequences. Each (W) and (Y) are made of 3 swings , they’re having A,B,C structure in lower degree, or alternatively they can have W,X,Y labeling.
NIKKEI 1 Hour Elliott Wave Analysis 7.22.2021
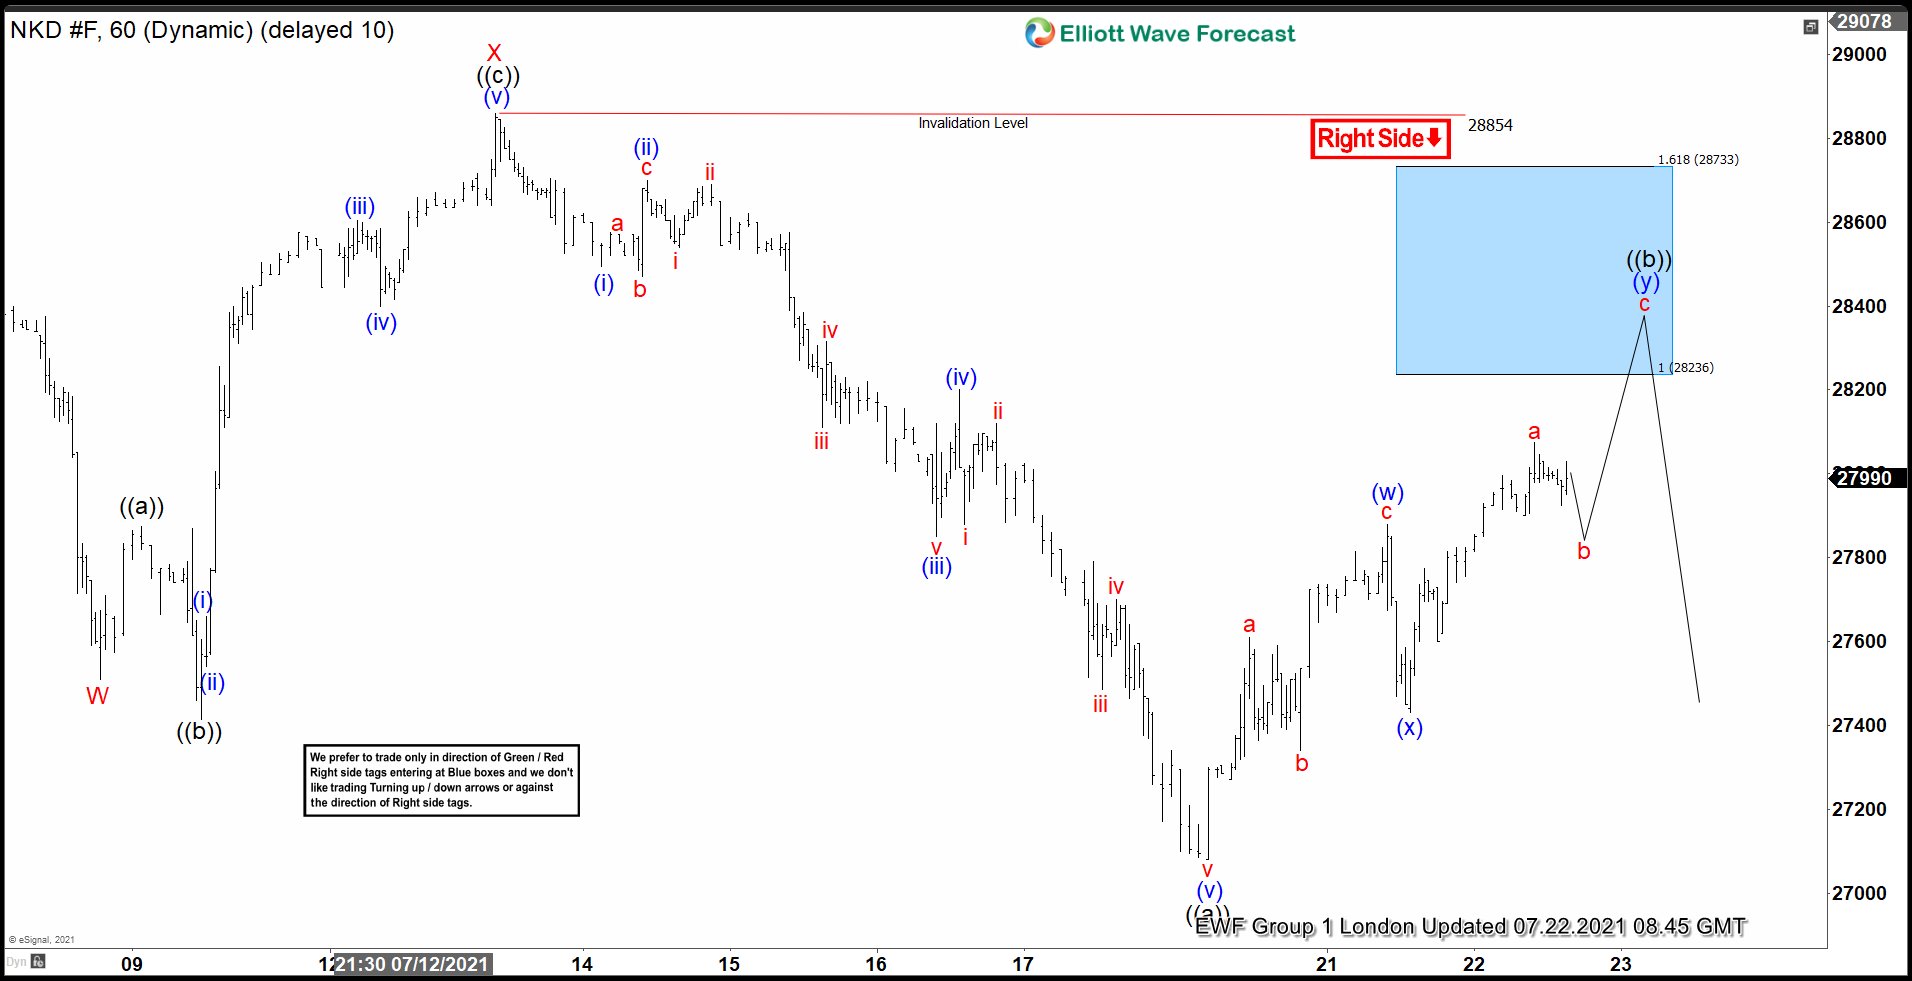
NIKKEI ended 5 waves down from the 28854 high. Currently the index is giving us ((b)) recovery against the mentioned peak. Correction is unfolding as Elliott Wave Double Three Pattern with (w) (x) (y) inner labeling. Wave ((b)) black recovery looks incomplete at the moment. It shows higher high structure, suggesting another leg up once short term pull back b red completes. The Index is looking for 28236-28733 area, to complete Double Three correction.
NIKKEI 1 Hour Elliott Wave Analysis 7.23.2021
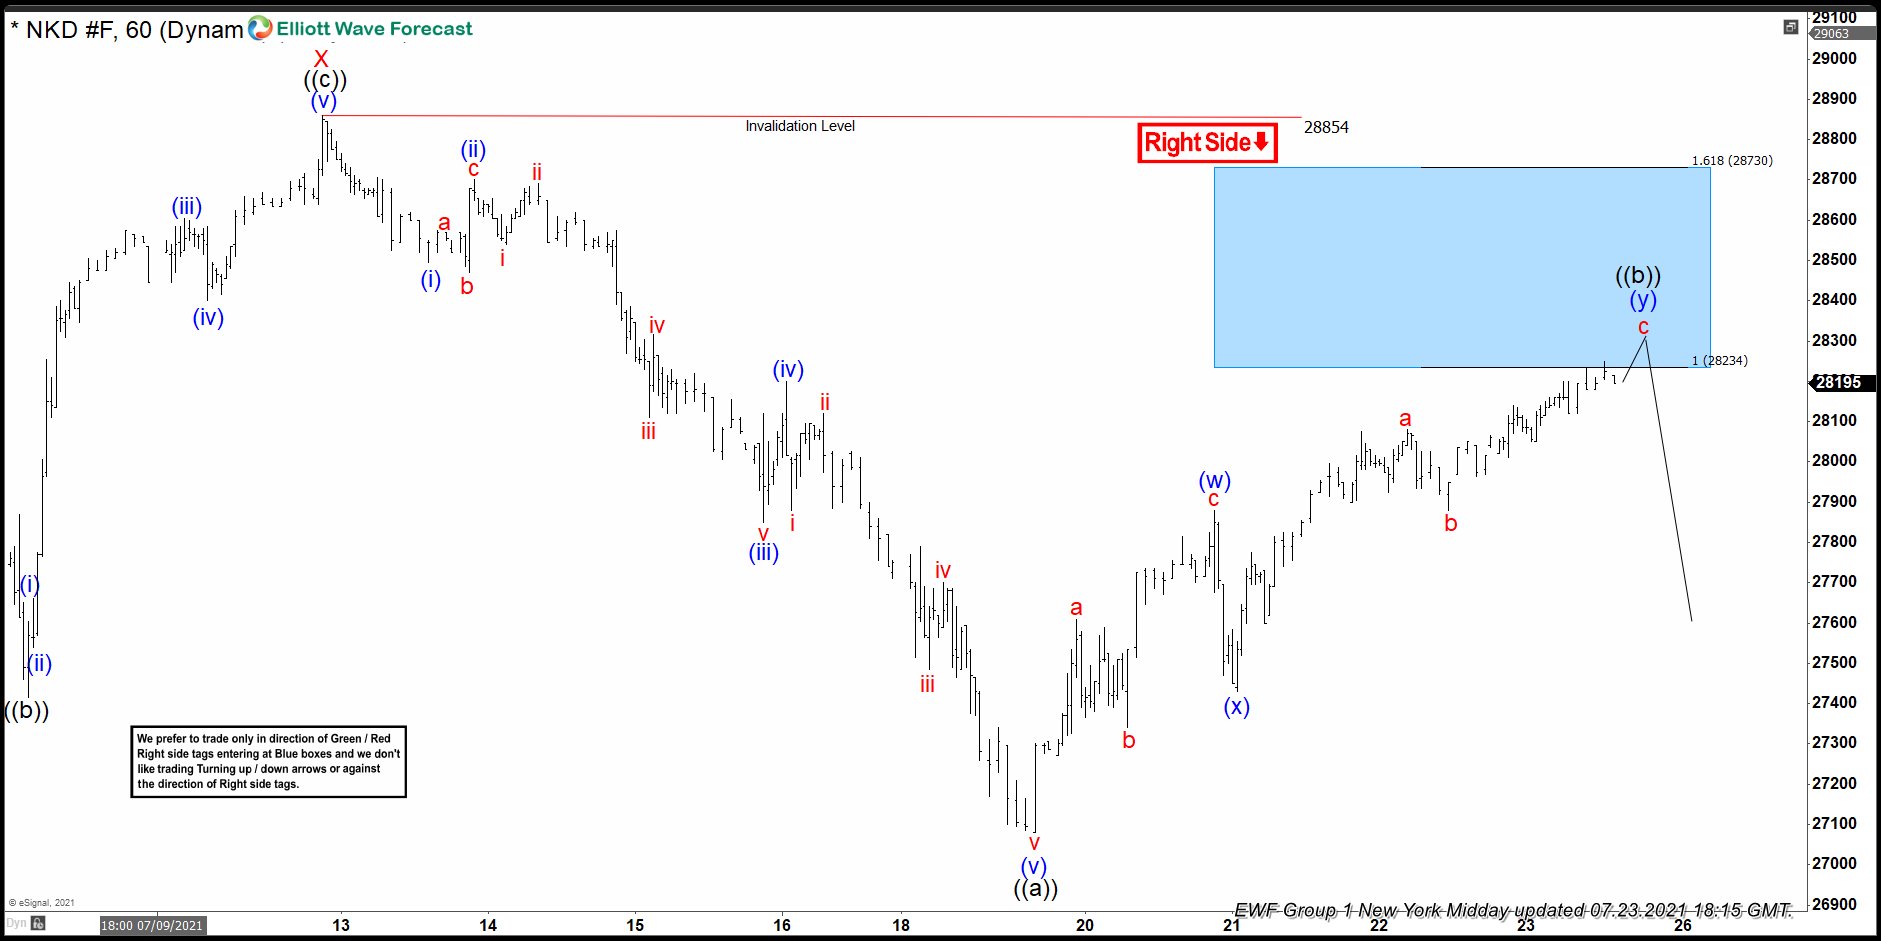
NIKKEI made rally as we expected. Price reached the extremes at 28234-28730 ( sellers zone). Minimum requirements are there. Recovery can complete any moment. We like to be sellers at the blue box zone, looking for further drop toward new lows ideally or in 3 waves pull back at least. Invalidation level for the trade is break above 1.618 fib extension (28730).
As our members know, Blue Boxes are no enemy areas , giving us 85% chance to get a reaction. Once the price reaches 50 Fibs against the (x) blue low, we will make long positions risk free ( put SL at BE).
NIKKEI 1 Hour Elliott Wave Analysis 7.27.2021
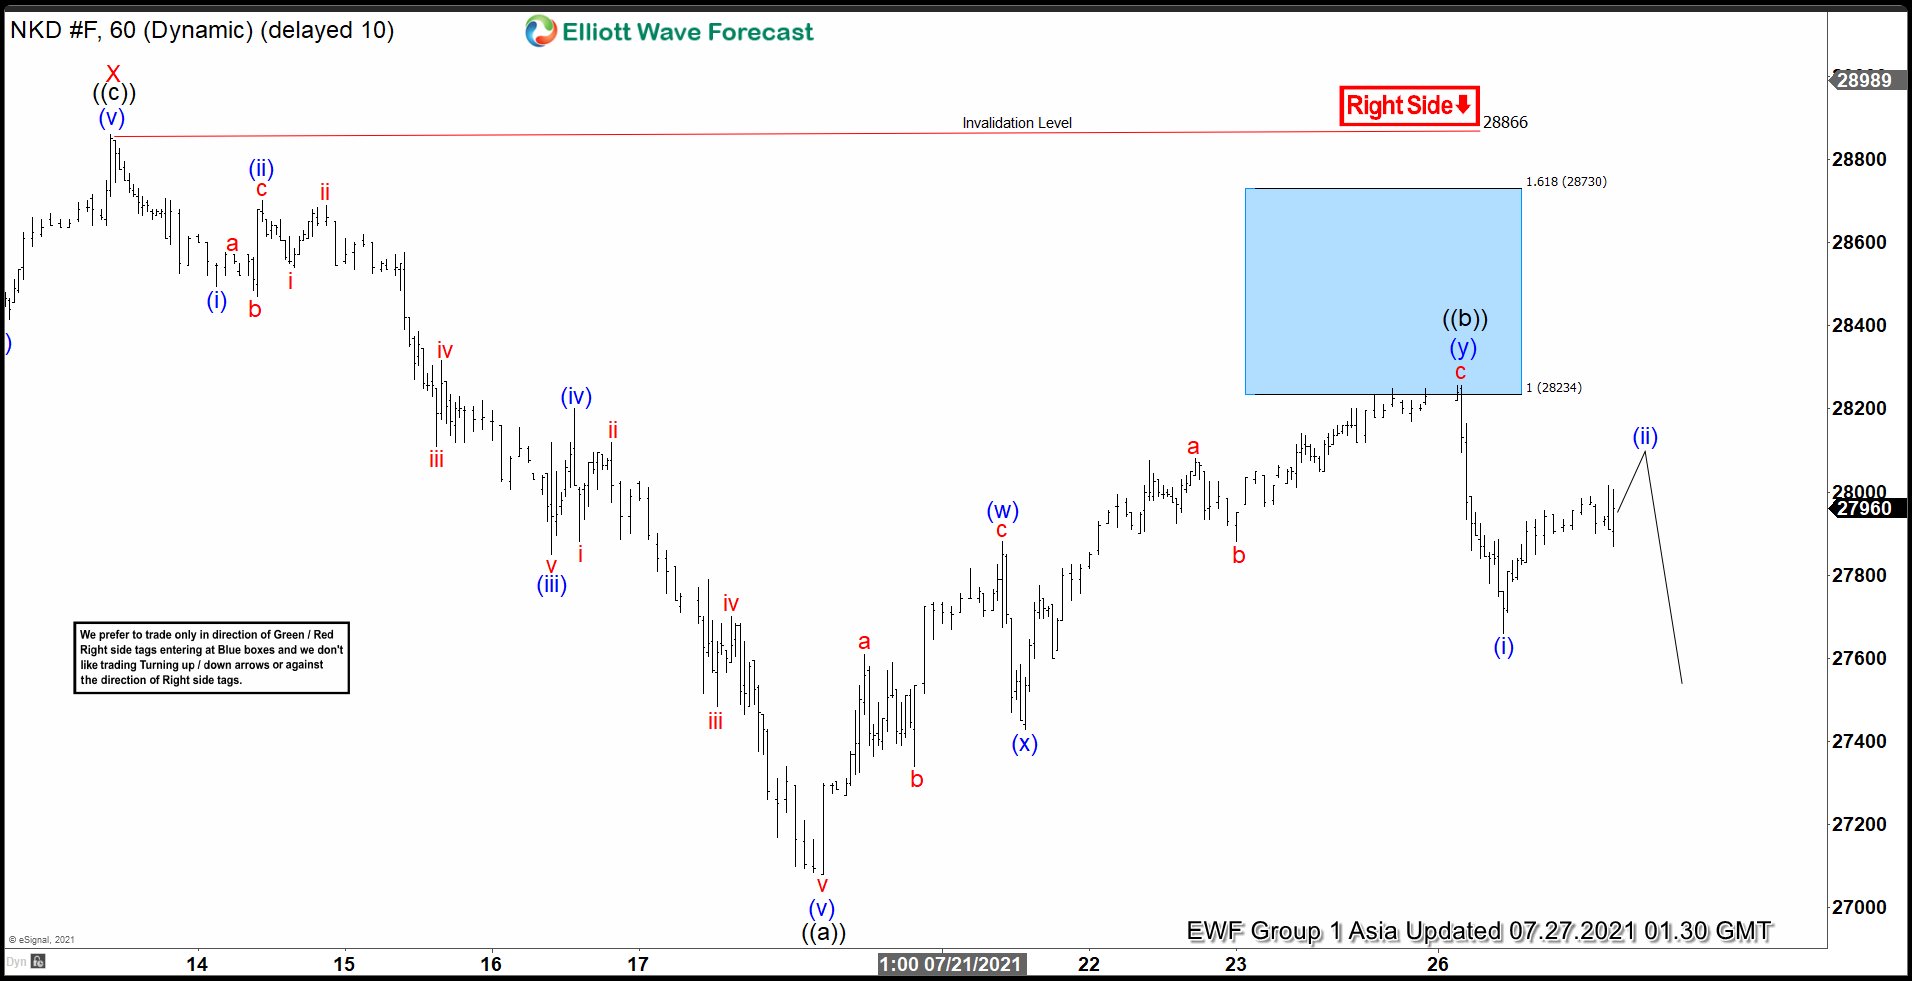
Sellers appeared at the blue box and we are getting good reaction from there. The decline from the blue box reached 50 fibs against the (x) connector, as a result short positions from the blue box are Risk Free. As far as the price stays below 28247, wave ((b)) recovery can be counted completed as Double Three. Once short term (ii) completes further drop should follow. We would like to see break below ((a)) black , 07/19 low to confirm next leg down is in progress.
Keep in mind that market is dynamic and presented view could have changed in the mean time. You can check most recent charts in the membership area of the site. Best instruments to trade are those having incomplete bullish or bearish swings sequences. We put them in Sequence Report and best among them are shown in the Live Trading Room.
Elliott Wave Forecast
Source: https://elliottwave-forecast.com/elliottwave/nikkei-found-sellers-elliott-wave-double-three-pattern/