
Hello fellow traders. In this technical blog we’re going to take a quick look at the Elliott Wave charts of OIL Futures ( $CL_F) , published in members area of the website. As our members know, we’ve been calling rally in the commodity due to impulsive bullish sequences. We recommended members to avoid selling in any proposed pull back and keep buying the dips in 3,7,11 swings. Recently OIL made pull back that has unfolded as Elliott Wave Zig Zag pattern . In the further text we are going to explain the Elliott Wave Pattern and trading strategy.
Before we take a look at the real market example, let’s explain Elliott Wave Zigzag.
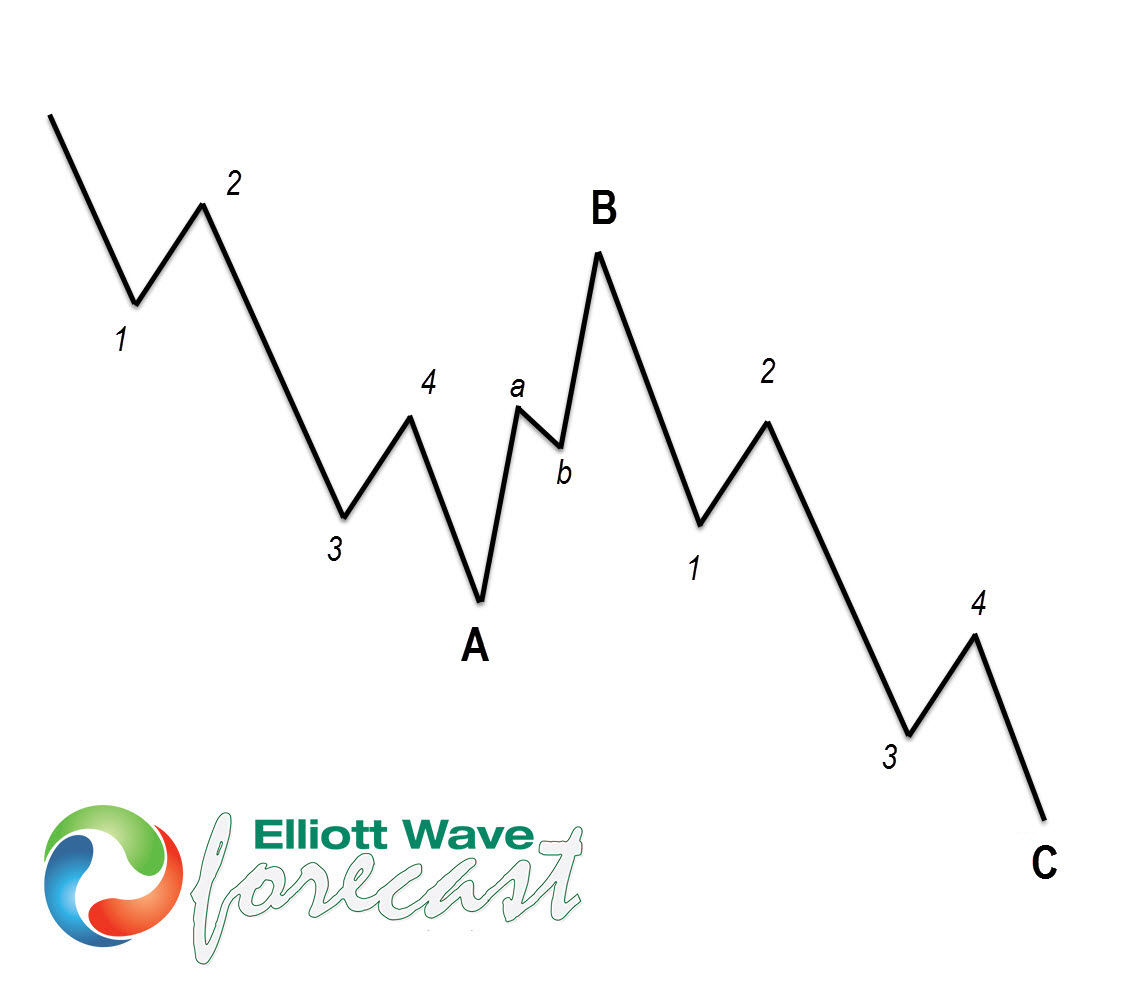
Elliott Wave Zigzag is the most popular corrective pattern in Elliott Wave theory . It’s made of 3 swings which have 5-3-5 inner structure. Inner swings are labeled as A,B,C where A =5 waves, B=3 waves and C=5 waves. That means A and C can be either impulsive waves or diagonals. (Leading Diagonal in case of wave A or Ending in case of wave C) . Waves A and C must meet all conditions of being 5 wave structure, such as: having RSI divergency between wave subdivisions, ideal Fibonacci extensions and ideal retracements.
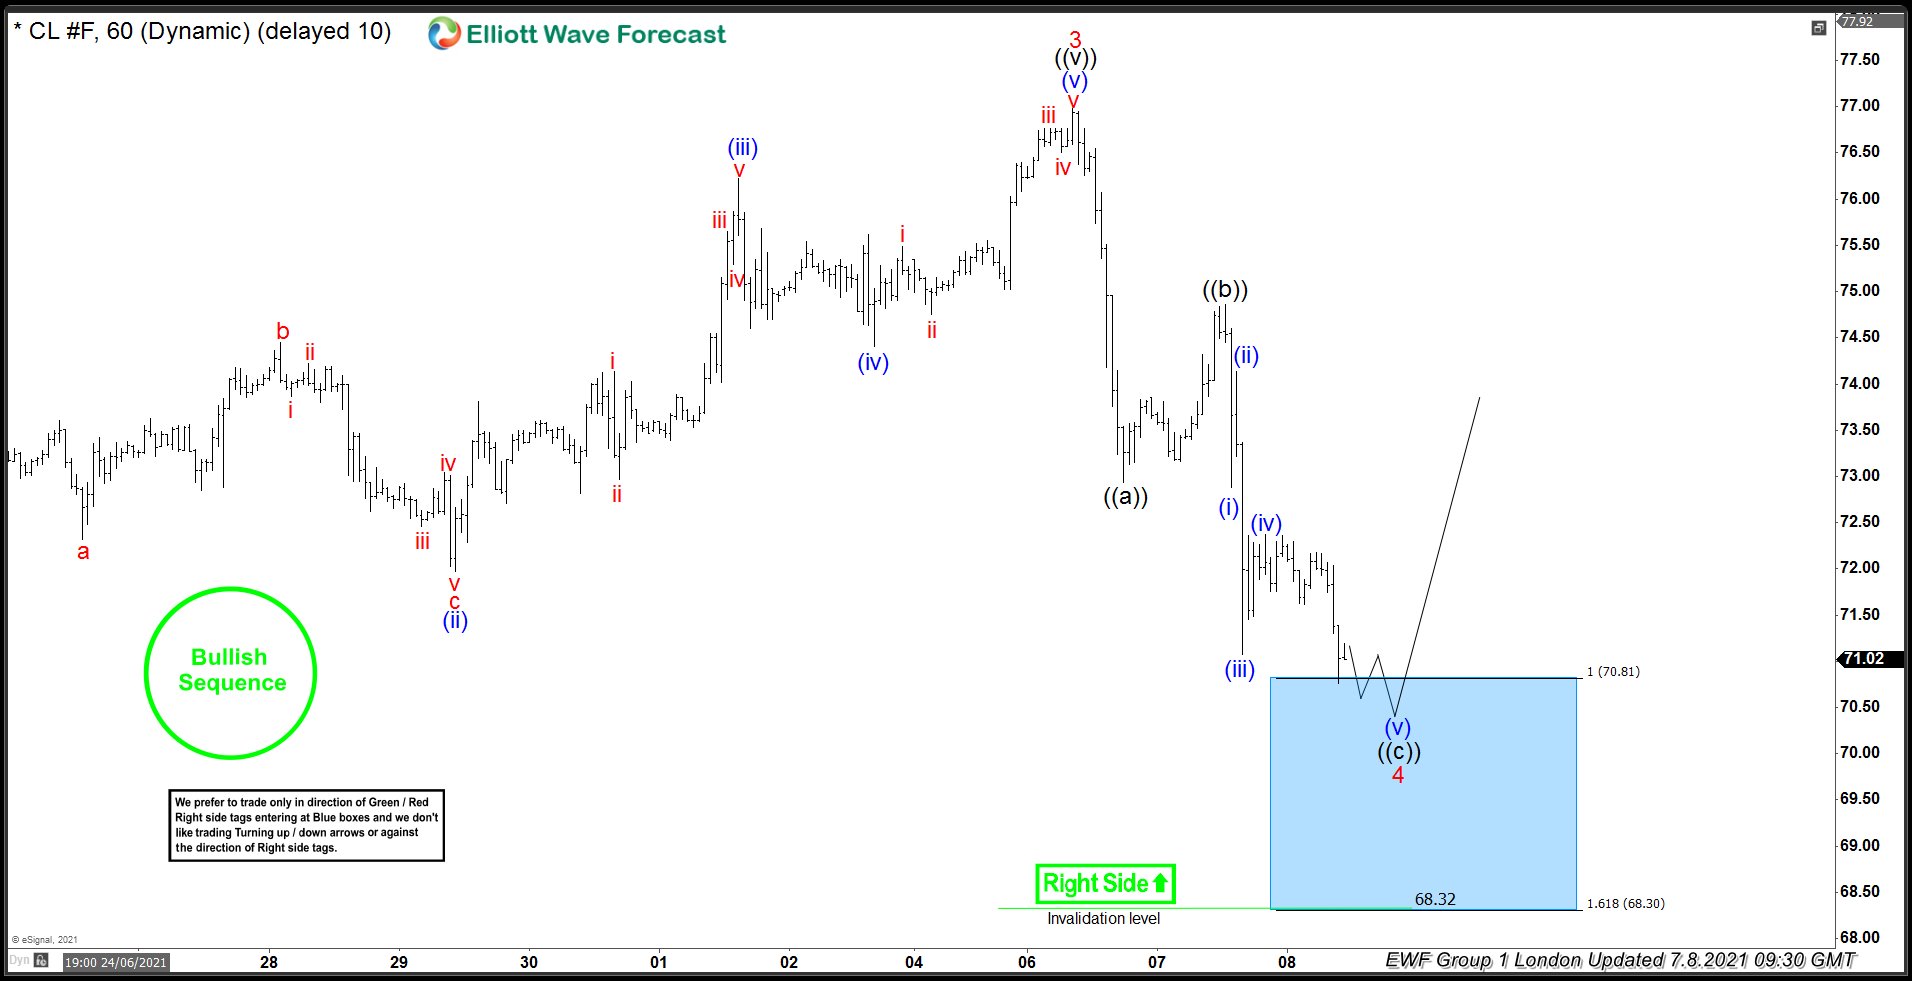
OIL Elliott Wave 1 Hour Chart 7.8.2021
Current view suggests the commodity is doing 4 red correction that is unfolding as Elliott Wave Zig Zag Pattern. First leg ((a)) was very sharp decline, if we downgrade it we can see clear 5 waves. Then we got clear 3 waves bounce in ((b)), after which we got 5 waves down in ((c)). The price has already reached extremes from the peak. Equal legs ((a))-((b)) is marked as the blue box on the chart: 70.81-68.3 which is entry area for the buyers. As the main trend is bullish we expect buyers to appear for 3 waves bounce at least. Once bounce reaches 50 Fibs against the ((b)) black high, we will make long position risk free ( put SL at BE)
As our members know, Blue Boxes are no enemy areas , giving us 85% chance to get a bounce.
You can learn more about Elliott Wave Zig Zag Patterns at our Free Elliott Wave Educational Web Page.
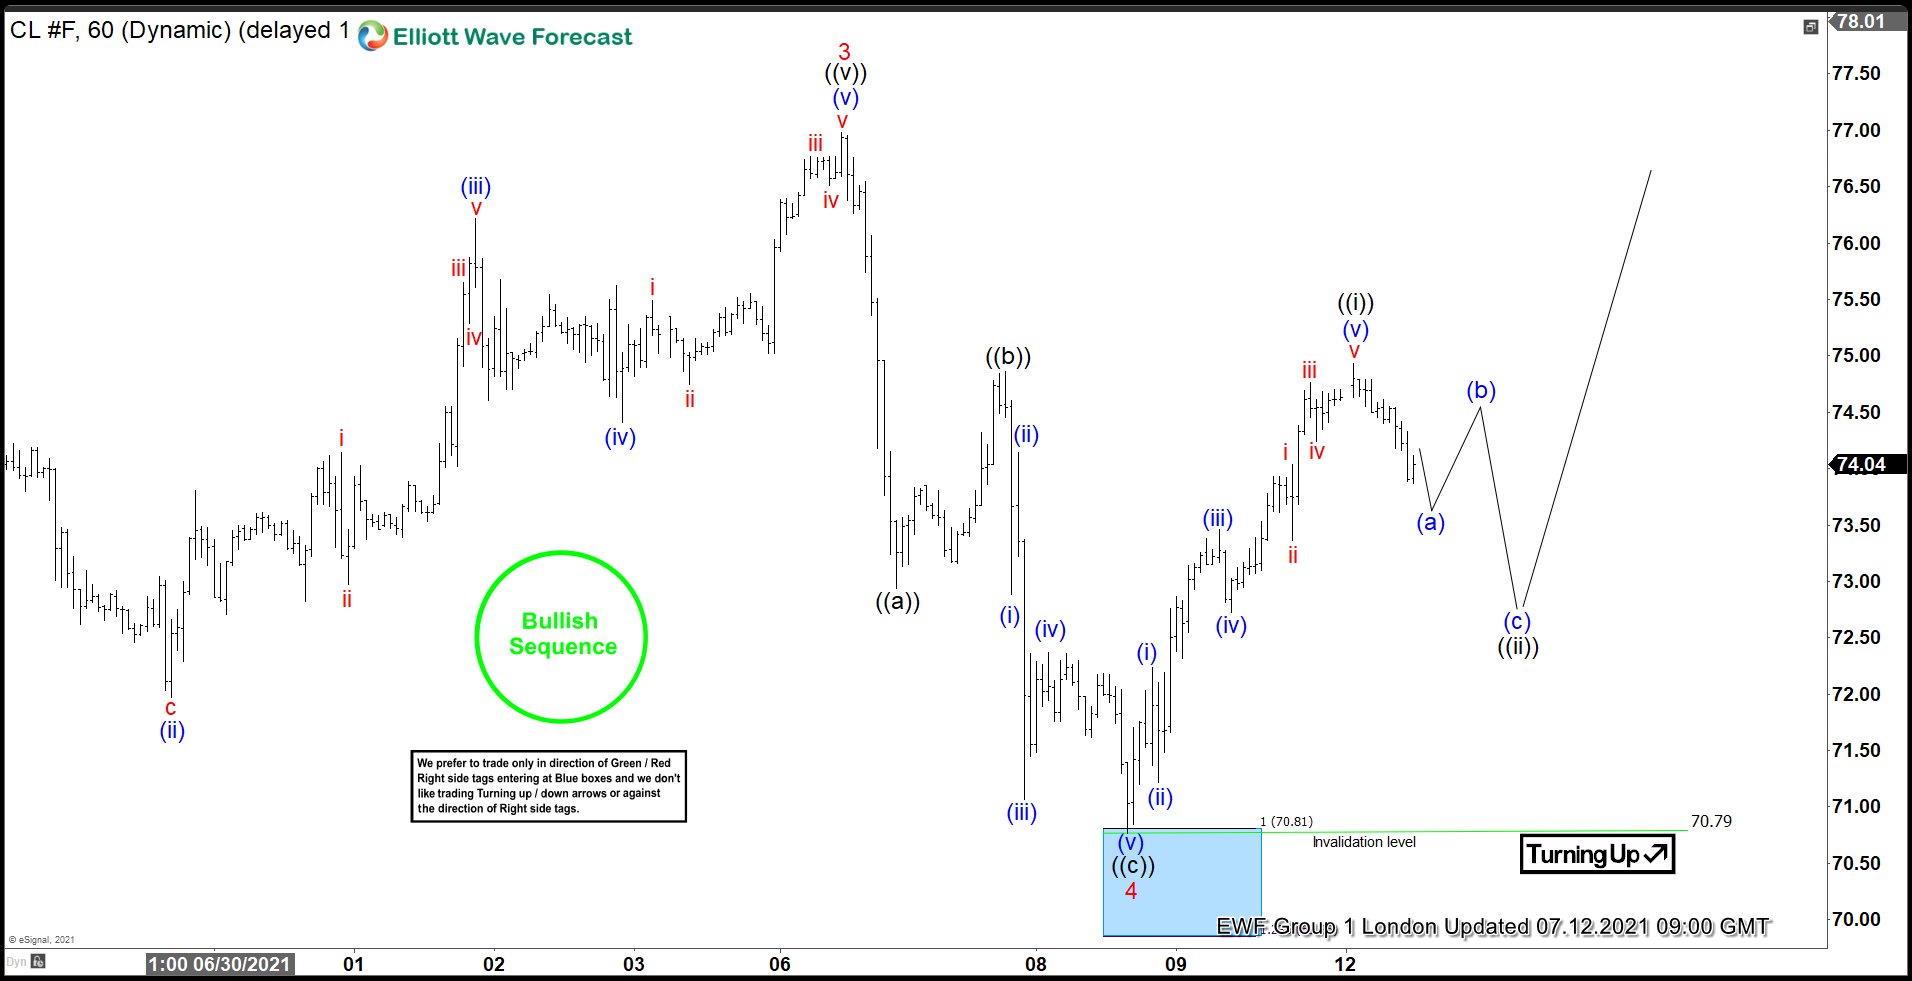
OIL Elliott Wave 1 Hour Chart 7.12.2021
Buyers appeared right at the equal legs area and we got decent reaction. Members who took long trades should have made positions risk free. Current view suggests 4 red pull back is done at the 70.79 low. Short term cycle from the mentioned low, looks completed as 5 waves rally- ((i)) black. After 3 waves pull back in ((ii)) , we expect to see further strength in commodity toward new highs ideally. If the price breaks 70.79 deeper correction would be in progress, as 7 swings pattern which should ideally provide us with new trading opportunities.
Keep in mind that market is dynamic and presented view could have changed in the mean time. Not every chart is trading recommendation. You can check most recent charts in the membership area of the site. Best instruments to trade are those having incomplete bullish or bearish swings sequences. We put them in Sequence Report and best among them are shown in the Live Trading Room.
Elliott Wave Forecast
Source: https://elliottwave-forecast.com/trading/oil-cl_f-buying-elliott-wave-zig-zag/