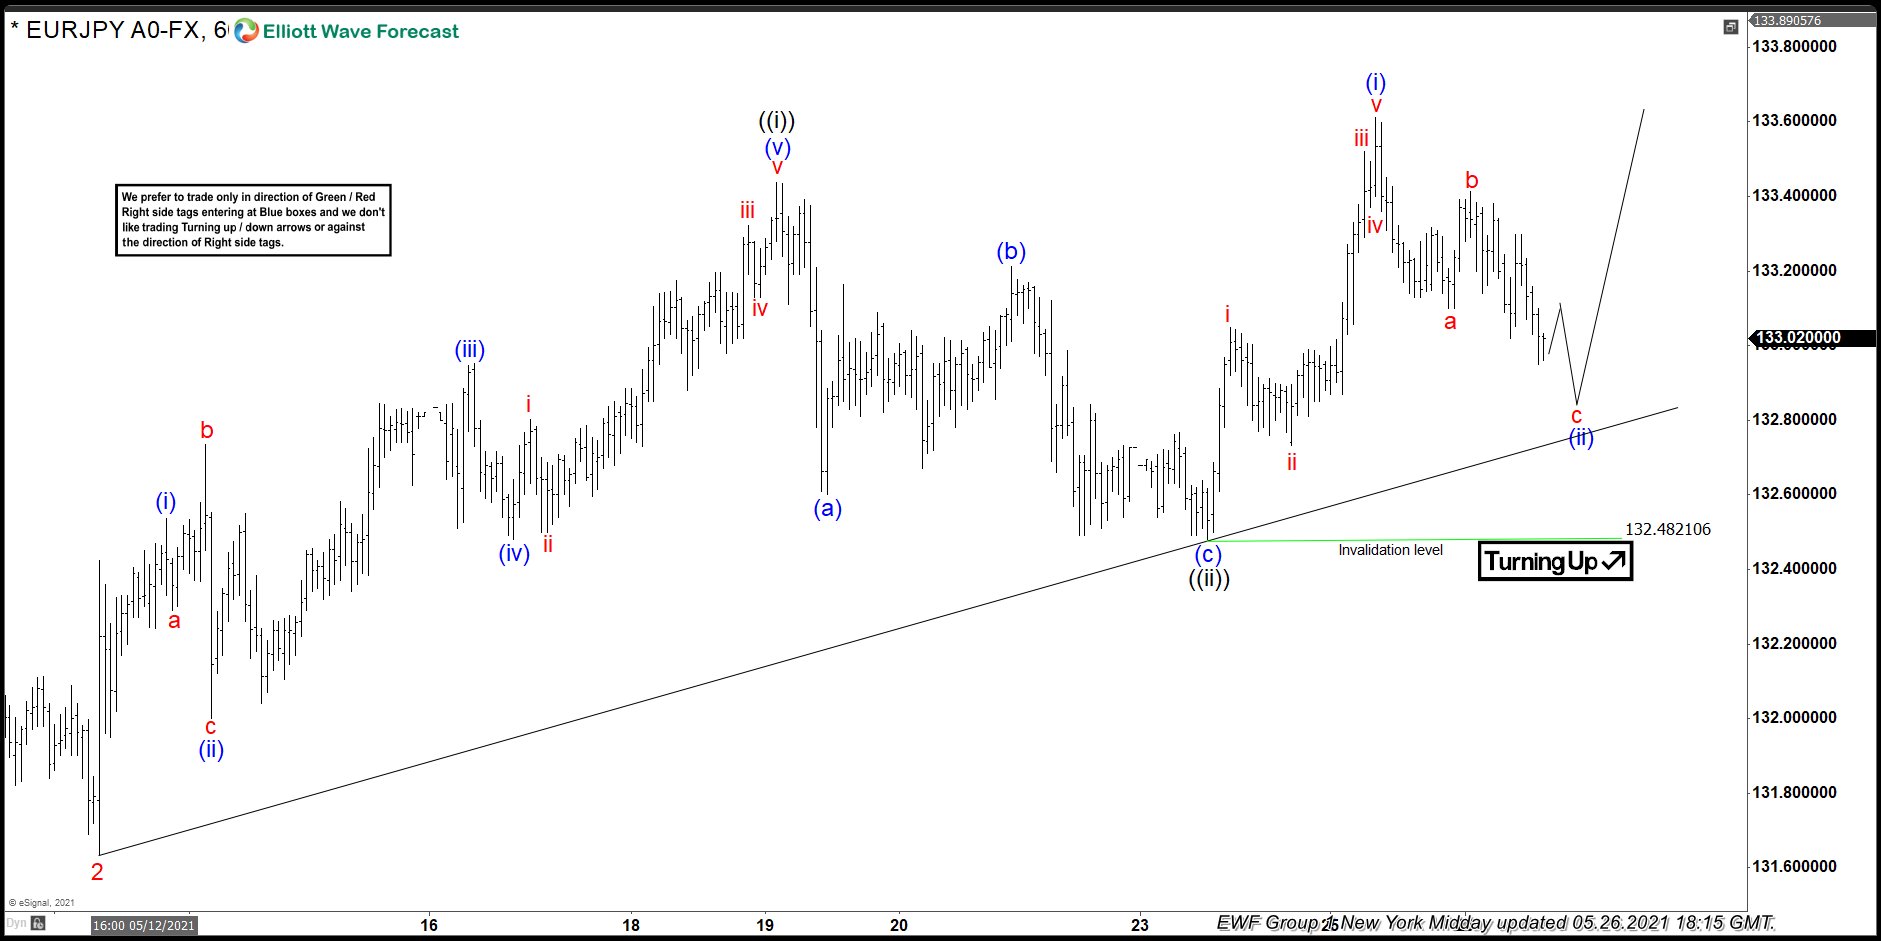
Since May 2020 to May 2021 EURJPY has been trending higher for the whole 12 months. On May 26 2021 we advised traders, in our members area, that EURJPY was in a position where the pair will make another move higher. We at EWF always encourage our members to trade with the trend and not against it.
EURJPY 1 Hour Chart New York Midday Update 5.26.2021
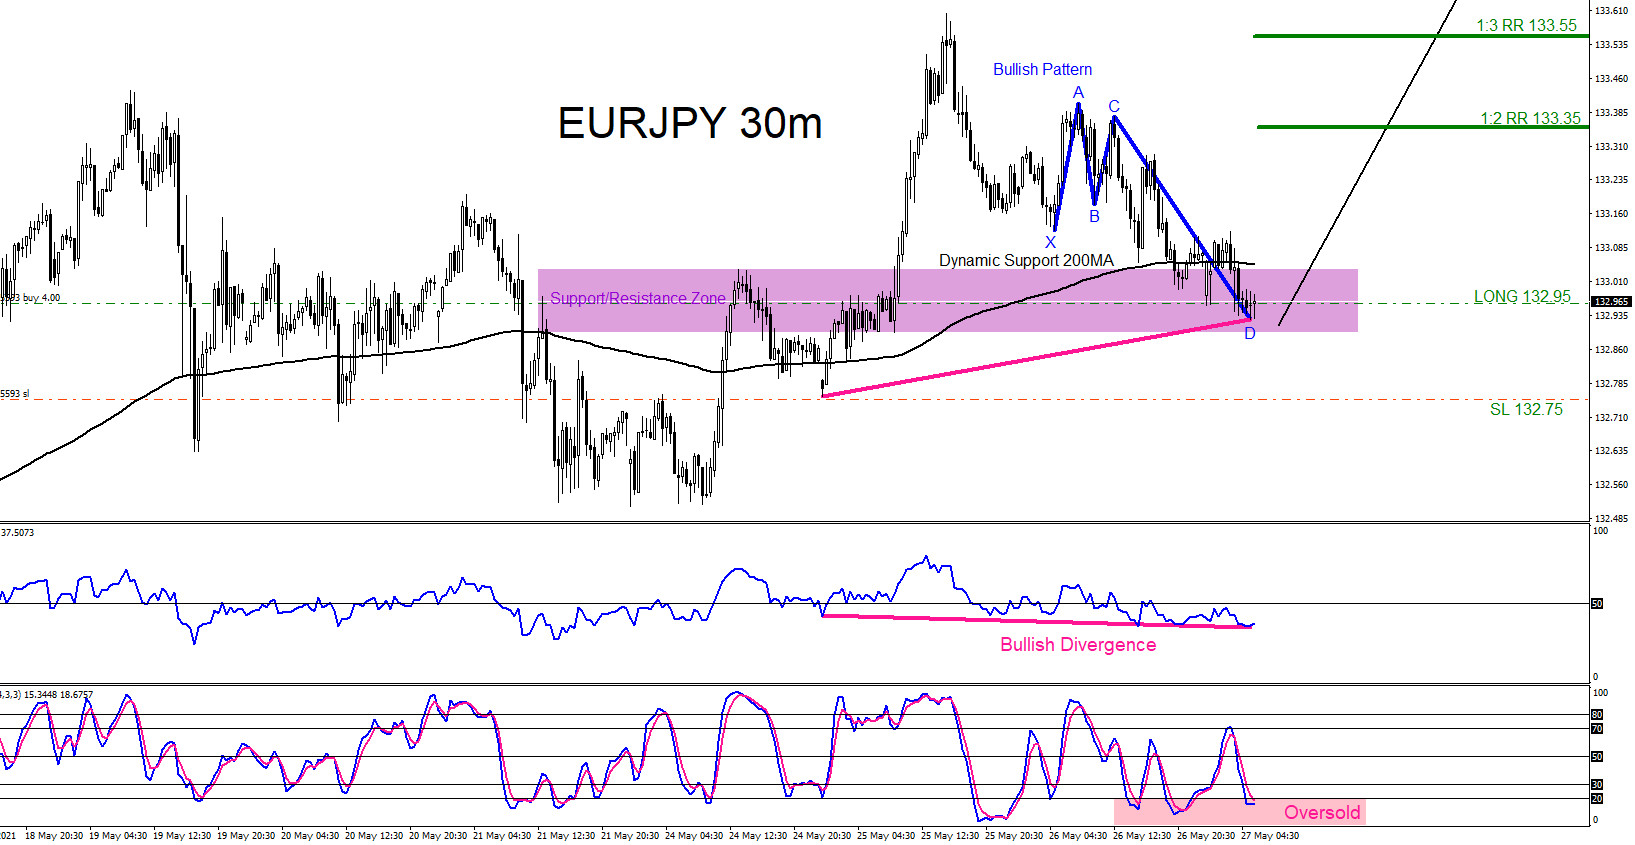
The bullish patterns in the chart below also adds more confidence to the bullish Elliott Wave count. Price entered the support/resistance zone (purple) while completing a bullish pattern (blue) signalling traders that this zone could produce a bounce higher. More added reason the pair could push higher was a bullish divergence pattern (pink) formed in the same confluence area support/resistance zone and indicator also entered the oversold levels signalling of a possible reversal higher. Entered the BUY trade at 132.95 with a tight Stop Loss at 132.75 and Targets at the 1:2 RR minimum.
EURJPY 30 Minute Chart 5.26.2021
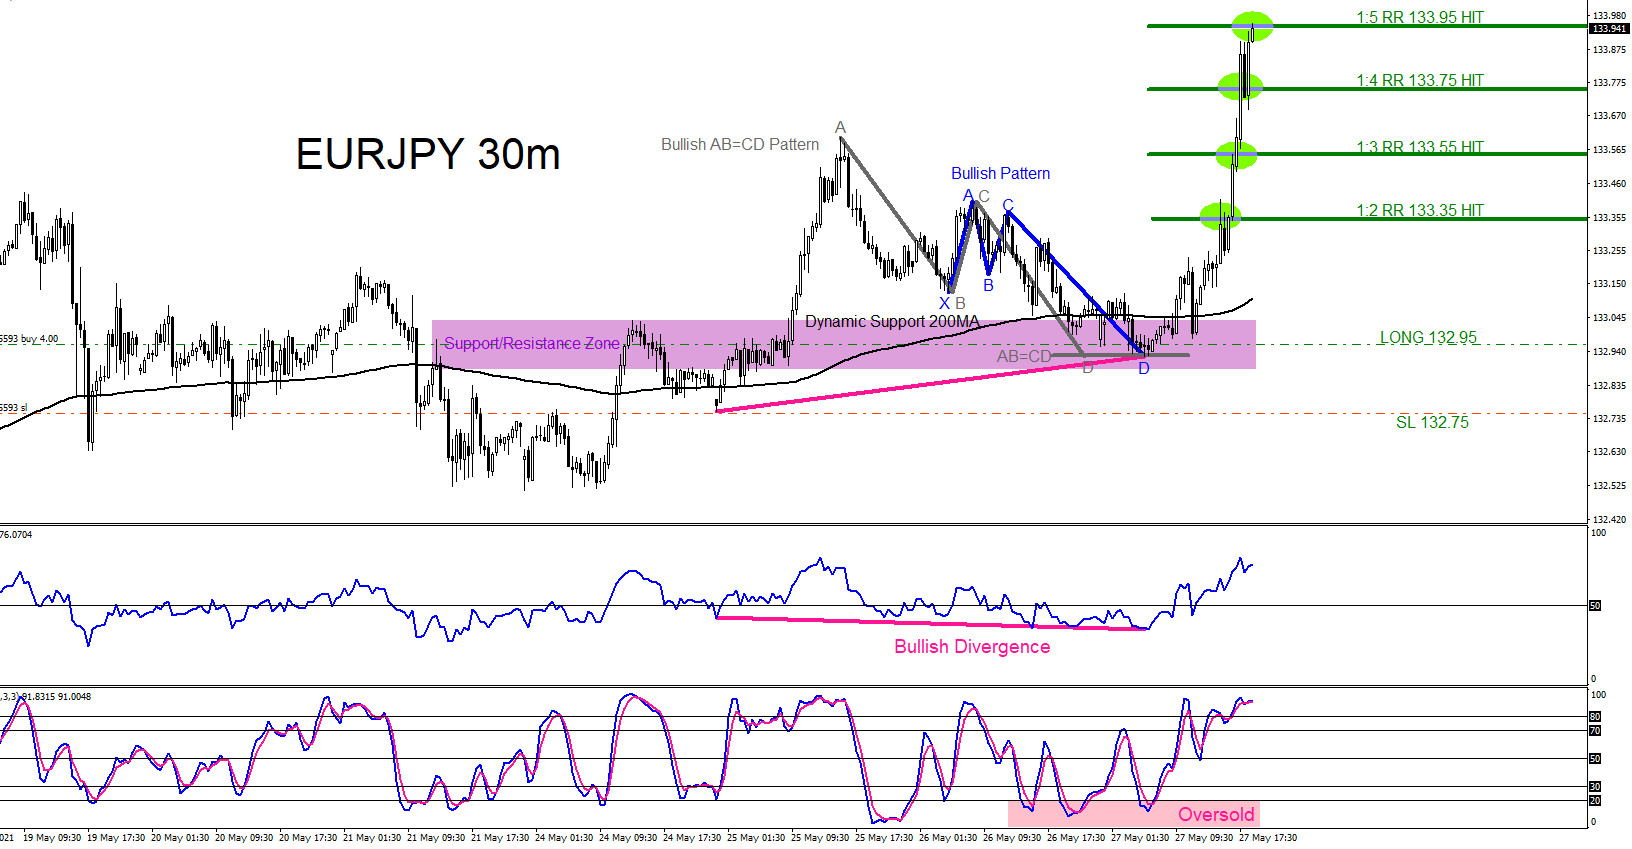
EURJPY eventually moves higher strongly and on May 27 2021 price hits the 1:5 RR target at 133.95 from 132.95 for +100 pips. A trader should always have multiple strategies all lined up before entering a trade. Never trade off 1 simple strategy. When multiple strategies all line up it allows a trader to see a clearer trade setup.
EURJPY 30 Minute Chart May 27 2021
Of course, like any strategy/technique, there will be times when the strategy/technique fails so proper money/risk management should always be used on every trade.
Source: https://elliottwave-forecast.com/aidans-corner/eurjpy-trading-upside-move/