
Unifi Inc. is a global textile solutions provider based in Greensboro, North Carolina, USA. The stock being a component of the Russel3000 index can be traded under ticker $UFI at NYSE. Unifi is one of the world’s leading innovators in manufacturing synthetic and recycled performance fibers. The company is in a possession of proprietary technologies and produces goods for such end markets like apparel, automotive, furnishings, accessories, footwear and many more. Currently, we can see cotton as a basis for the textile industry turning higher. Therefore, Unifi being an important player in the textile market should be a great opportunity for investors to diversify their portfolio by indirect investement in the rising cotton prices.
Unifi Quarterly Elliott Wave Analysis 04.25.2021
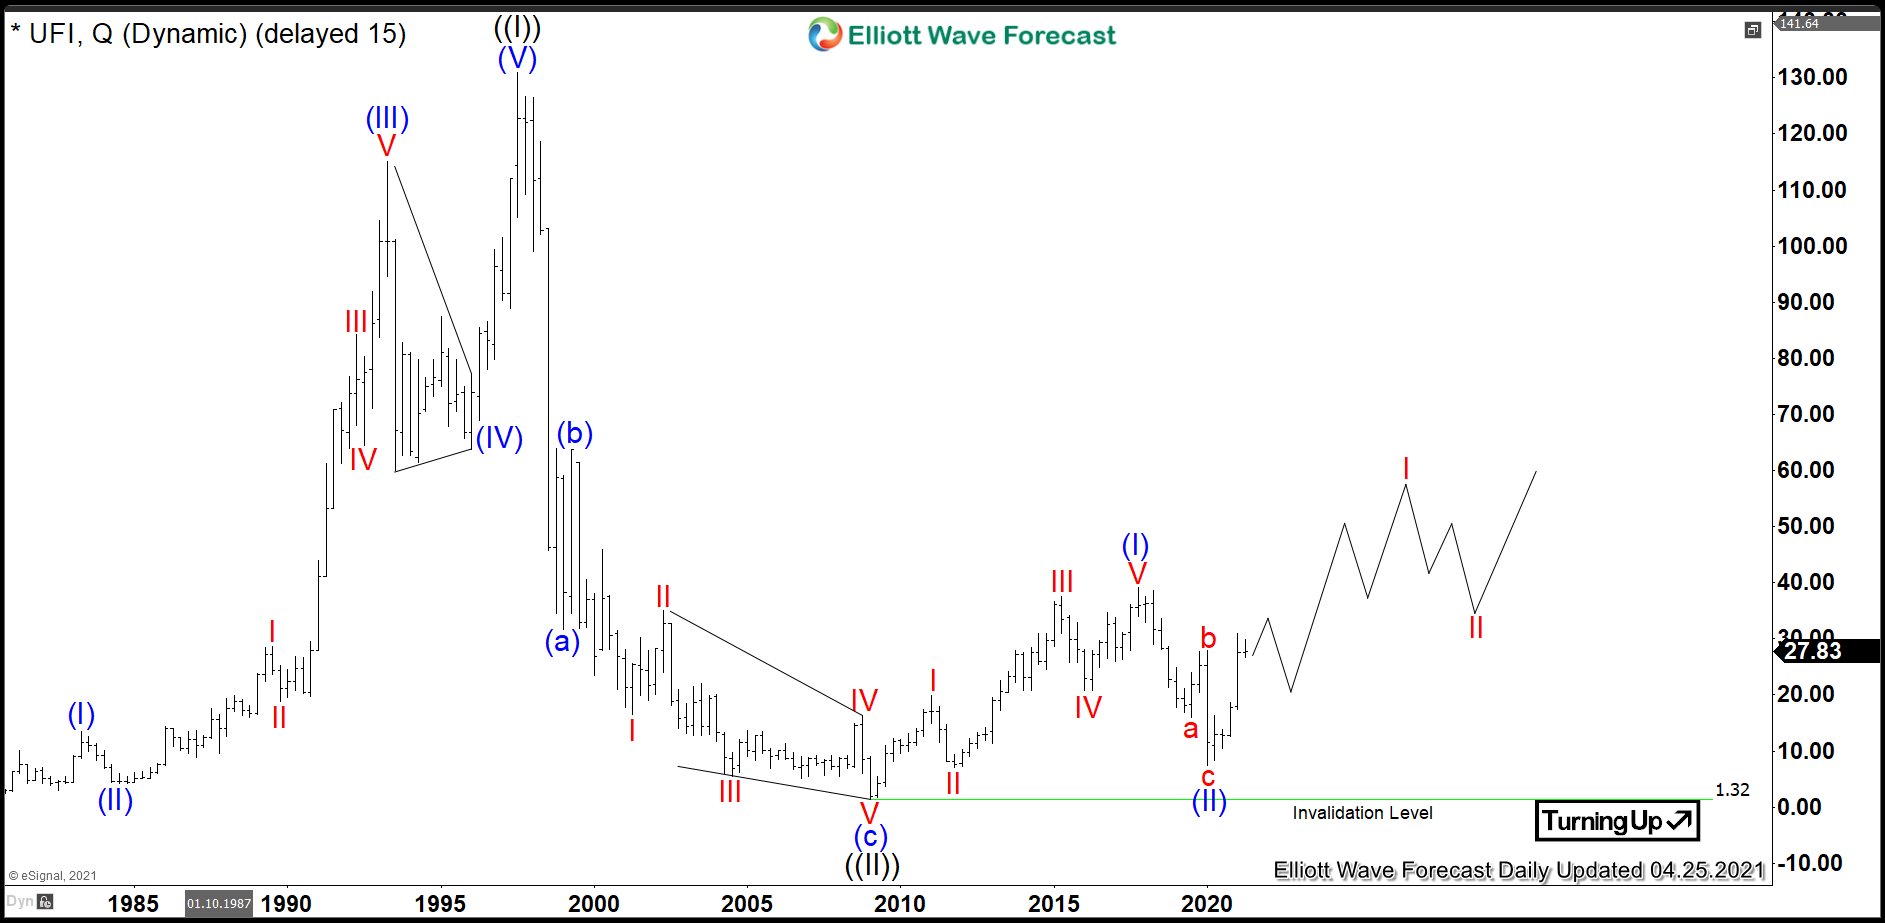
The Quarterly chart below shows the Unifi shares $UFI traded at NYSE. First, the stock price has developed an impulse higher in black wave ((I)) of grand super cycle degree. It has printed the all-time highs in the 3rd quarter of 1997 at 130.88. From the highs, a correction lower in black wave ((II)) has unfolded as an Elliott wave zigzag pattern. It has printed an important bottom in the 1st quarter of 2009 at 1.32. As a matter of fact, the stock price has lost 99% of its value within 12 years.
From 2009 lows, a new cycle in wave ((III)) has already started and should extend towards 130.88 highs and beyond. Then, the target for wave ((III)) will be towards 132.55-213.62 area and even higher.
From 2009 to 2017, we saw a motive cycle higher in blue wave (I) of black wave ((III)). It has ended at 39.21 highs. From the highs, a correction lower in 3 waves as blue wave (II) has ended in March 2020 at 7.48. Indeed, this can be seen a s a first nest within a larger wave ((III)). Now, from the lows, a new cycle in wave (III) of ((III)) may have already started.
Unifi Daily Elliott Wave Analysis 04.25.2021
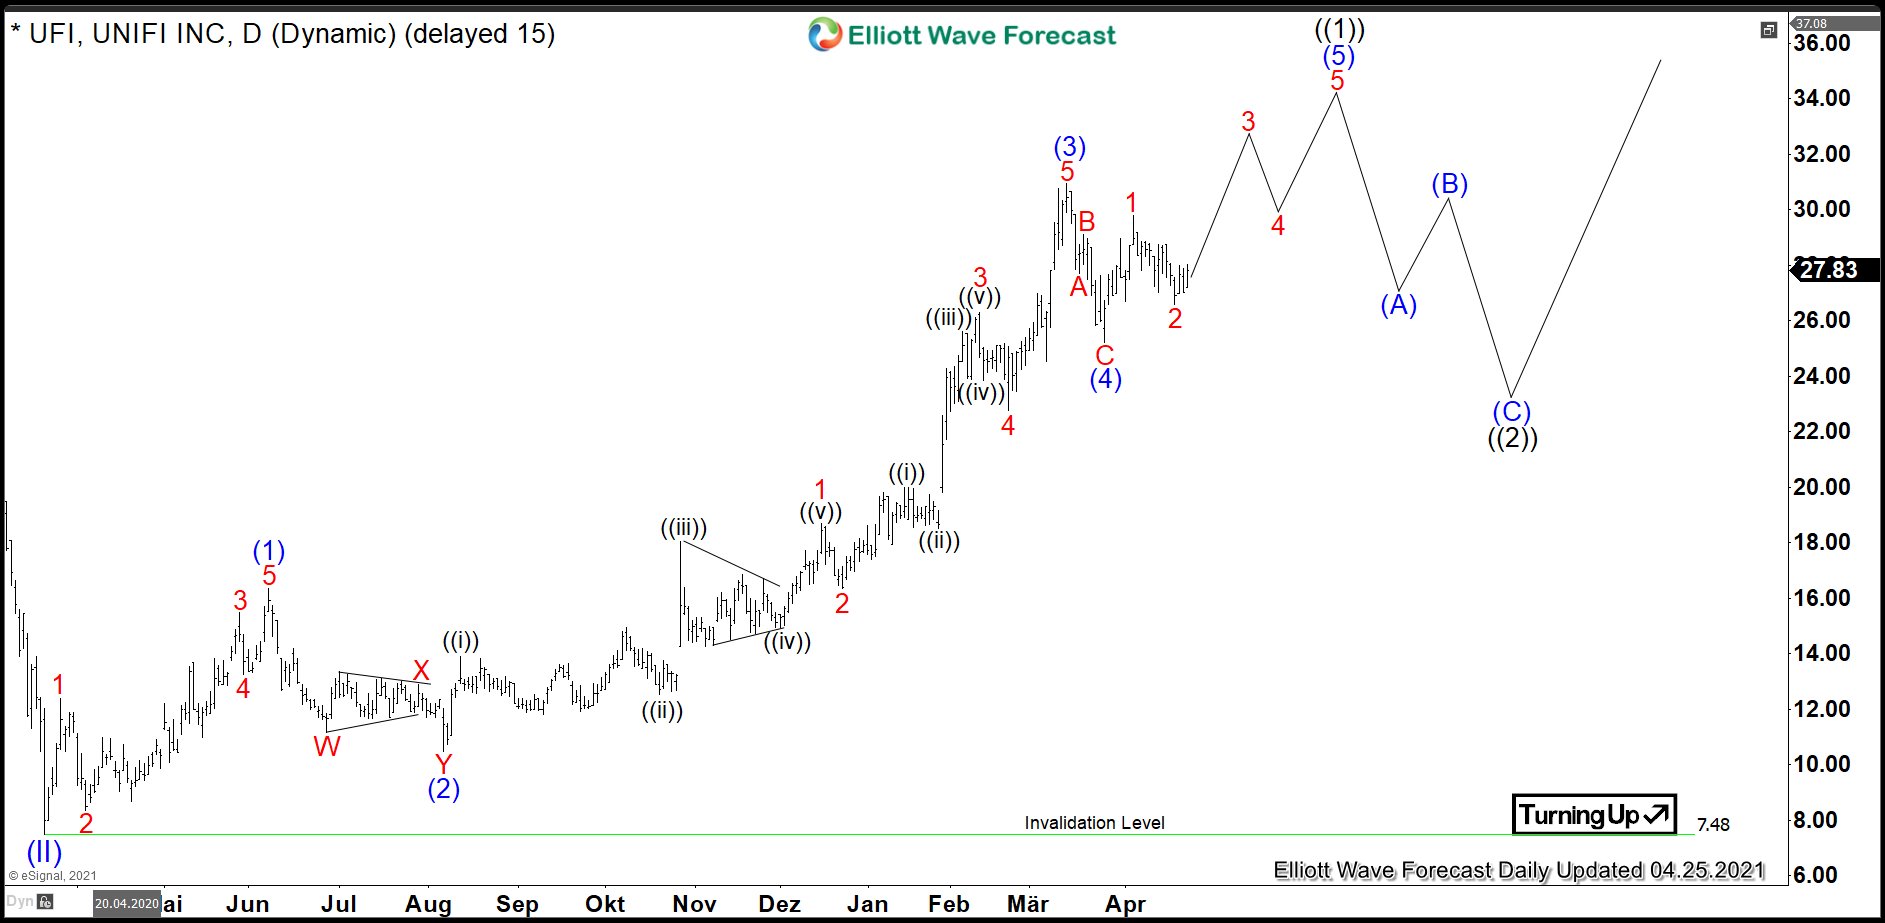
The daily chart below shows the early stages of the blue wave (III) of black wave ((III)). From the March 2020 lows, $UFI has developed blue waves (1)-(3) within the initial impulse in black wave ((1)). Currently, wave (4) might have ended and a blue wave (5) should see a new high. In overall, wave ((1)) can end soon. Therefore, it is risky to chase Unifi at current prices. Investors and traders can be looking to buy the pullback in wave ((2)) in 3, 7 or 11 swings against 7.48 lows targeting 45.29-68.71 area and even higher.
Source: https://elliottwave-forecast.com/stock-market/textile-provider-unifi-accelerate-higher/