
In this blog we take a look at US Real Estate ETF (IYR) reaction higher from the blue box.
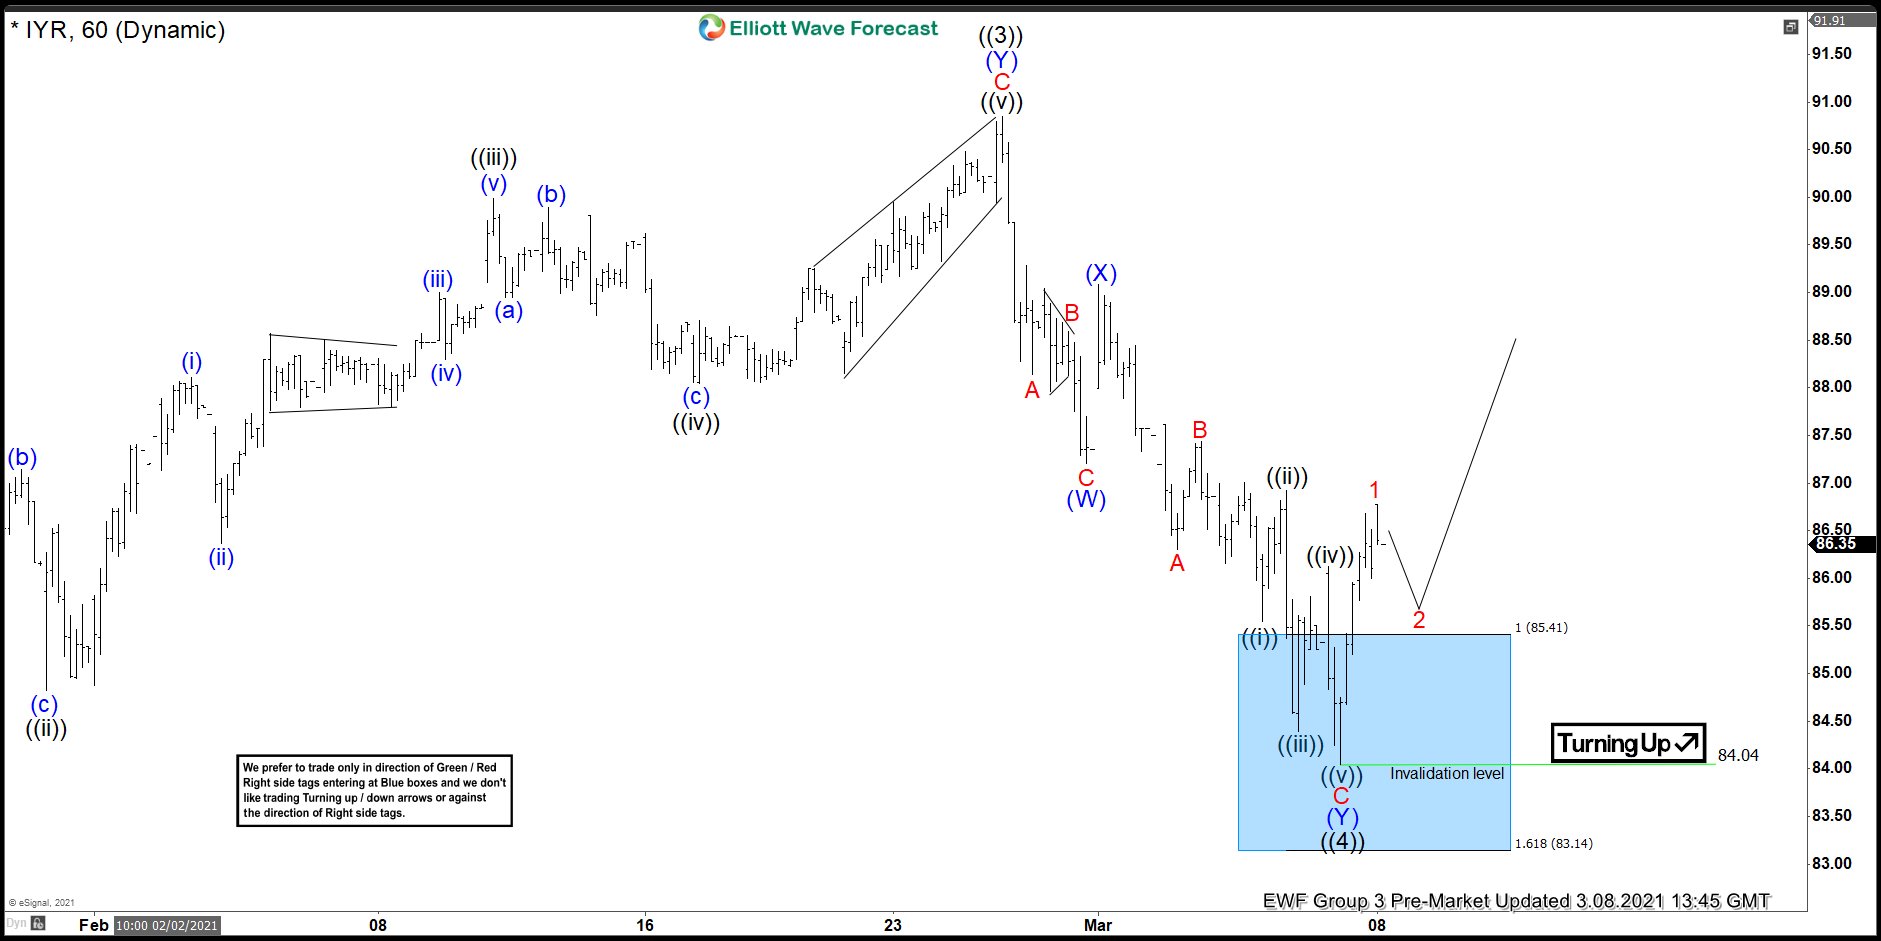
The 1 hour chart below is an update from 3/8/2021.We see that IYR peaked at the 90.50 to 91.00 area and completed black wave ((3)) of an anticipated leading diagonal. Down from there, the ETF made 7 swings lower into the blue box. Subsequent to the 7 swingsdecline, IYR completed wave ((4)) at 84.04. In the 7 swings we see blue waves (W), (X), and (Y). Within both blue waves (W) and (Y), we see clear 3 swings subdivisions, which is A-B-C zig zags. Zig zag subdivisions consist of five wabes in A and C, with a correction in B. However, in the chart below, we show only internal subdivisions within red wave C of blue wave (Y) due to chart space constraints. We also see that the ETF had already started to react higher from the blue box. We therefore proposed the 84.04 level as a level of invalidation.
Elliott Wave 1 Hour Chart 3/8/2021
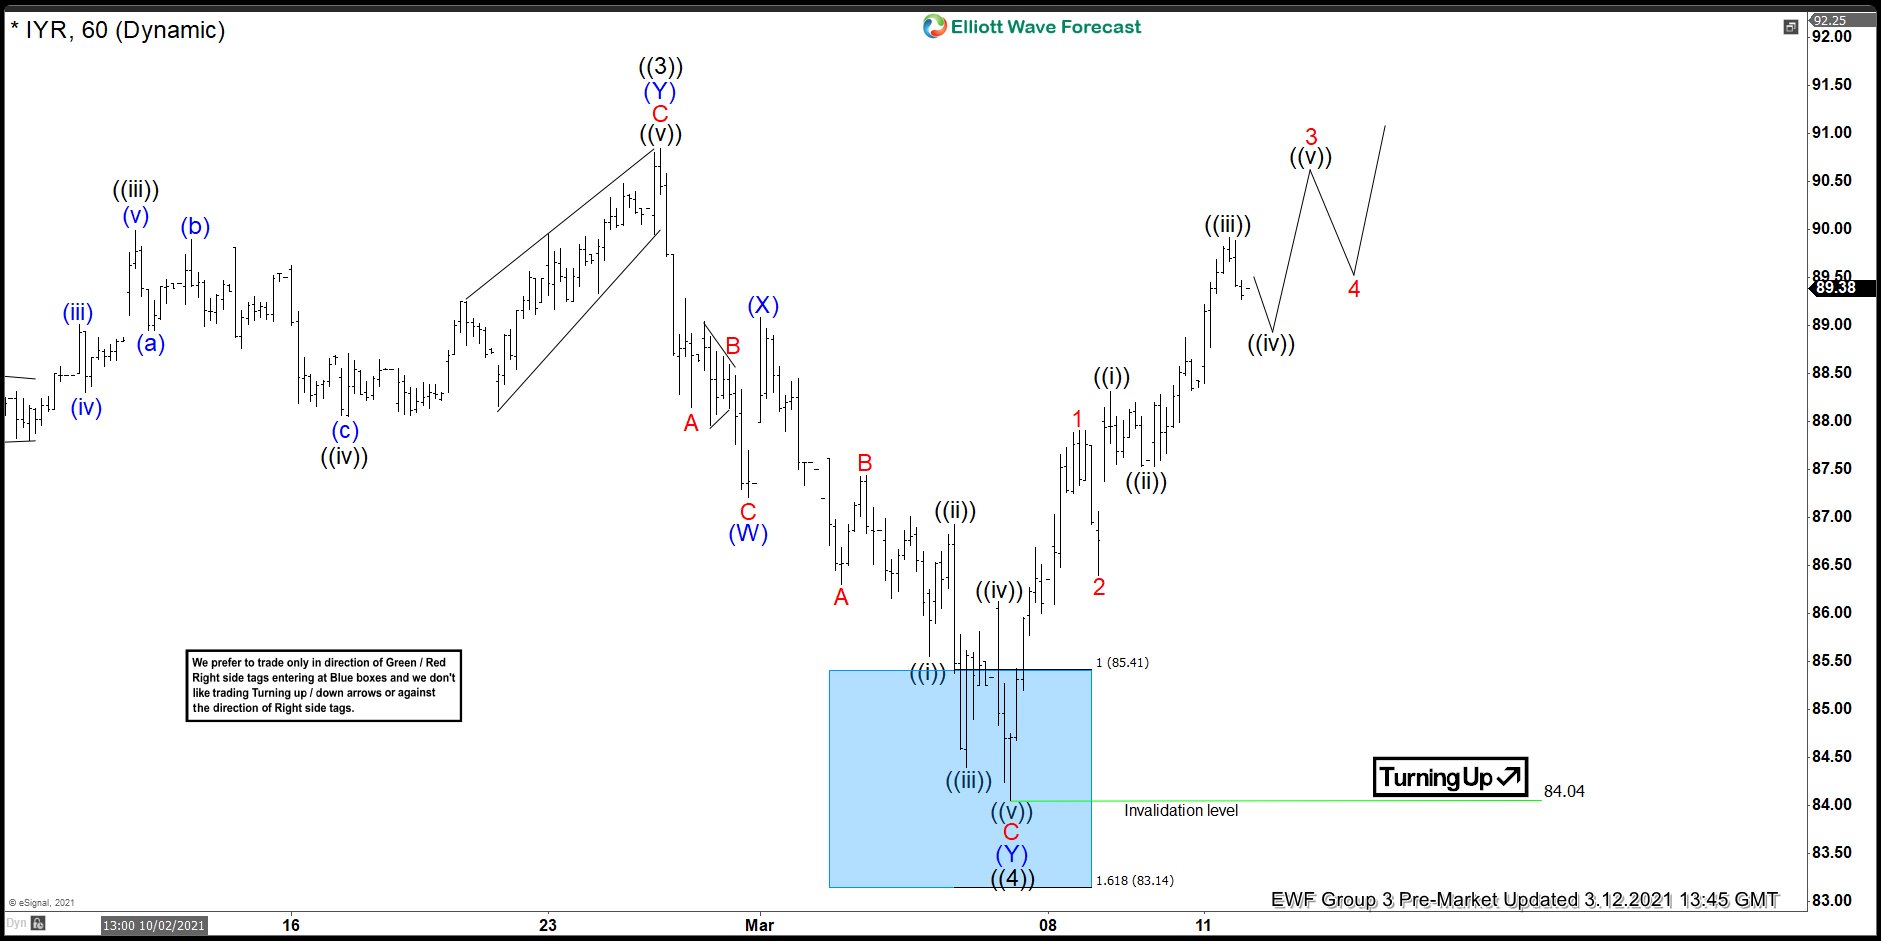
In the 1 hour chart below from 3/12/2021, we see further separation higher from the blue box. We anticipated this upside move from the blue box. We are able to anticipate such moves with our blue box system. All long positions from the blue box area were already running risk free. The right side remained upside. There is no reason therefore to sell IYR against it’s dominant upside trend.
Up from the blue box area, the ETF rallied in 5 swings in red wave 1. One may need to downgrade timeframe in order to see the swings in red wave 1 clearly. Naturally, we saw a correction follow in red wave 2 as per Elliot Wave nature of a motive sequence. We confirmed the next leg higher in red wave 3 once red wave 1 peak was broken. Although incomplete, we expected continuation higher in red wave 3, then 4 and 5 of bigger degree blue wave (1).
Elliott Wave 1 Hour Chart 3/12/2021
Source: https://elliottwave-forecast.com/stock-market/iyr-rallies-blue-box/