
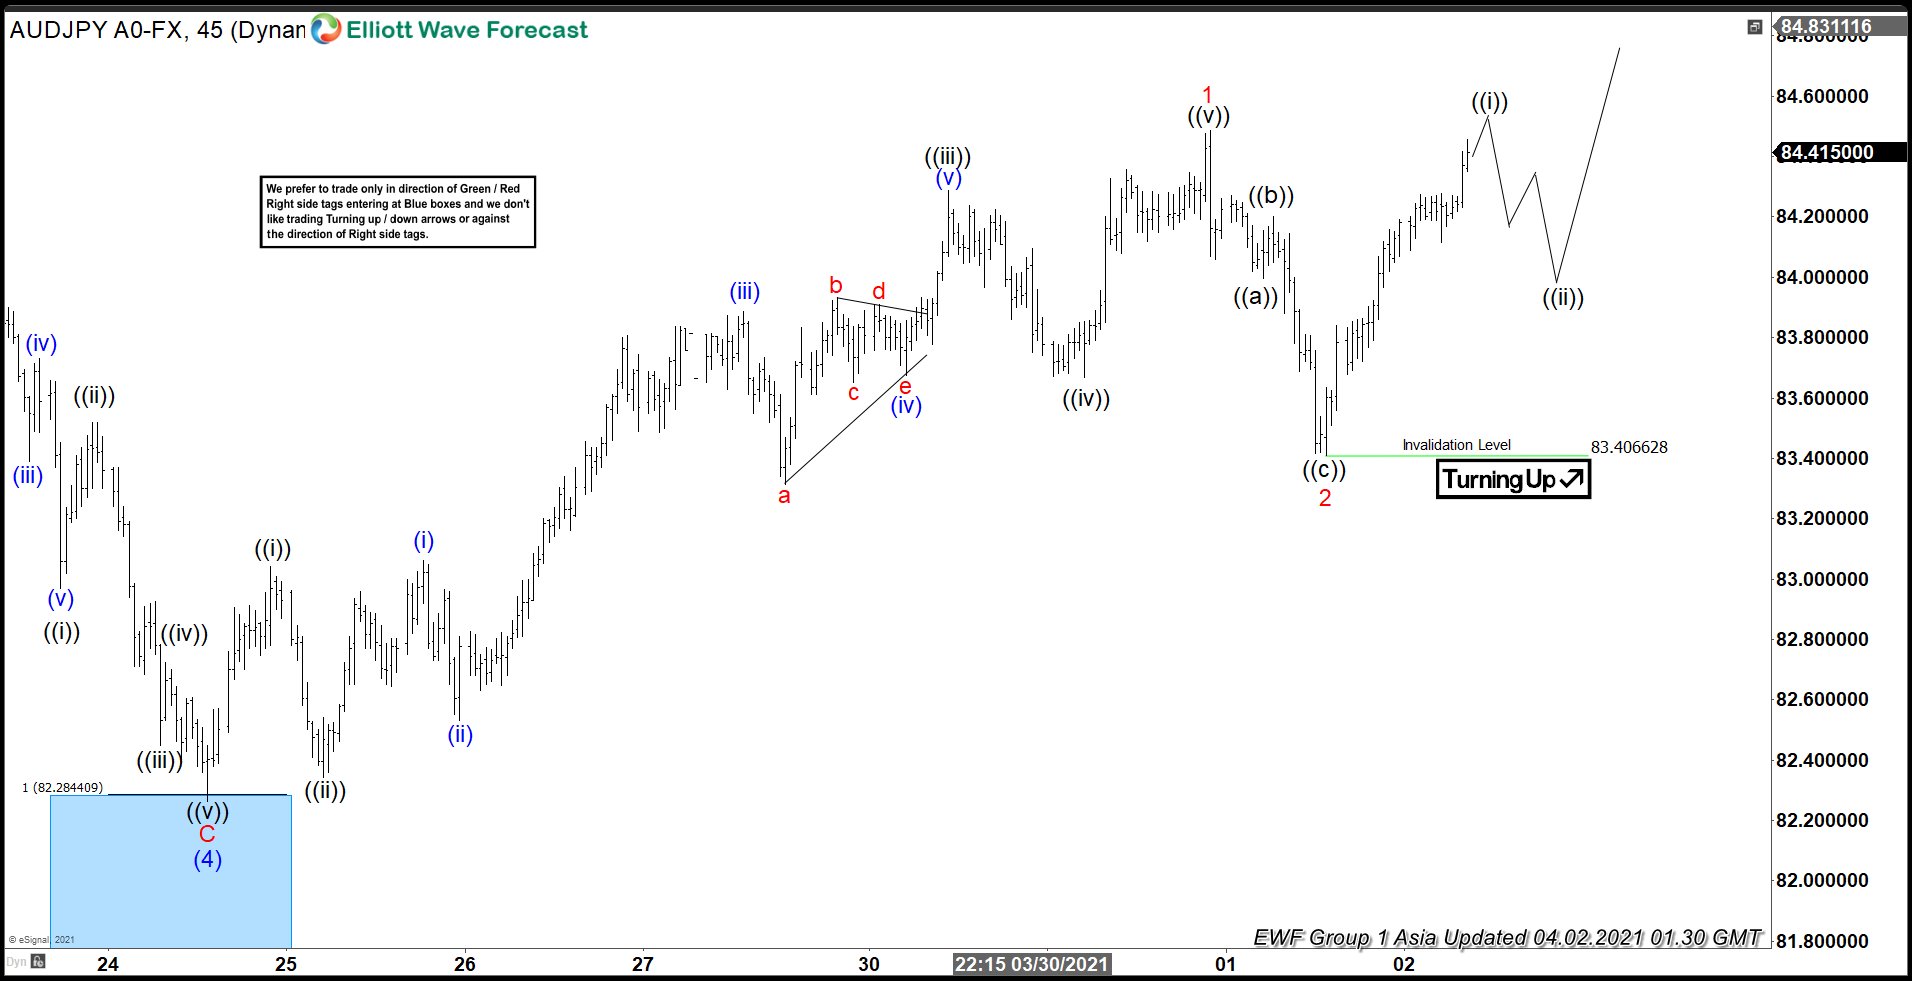
45 Minutes Elliott Wave chart below suggests AUDJPY ended wave (4) pullback at 82.26 in the blue box area. This area is the 100% – 161.8% Fibonacci extension area from wave (3) peak at 85.449. Pair has since turned higher in wave (5). The internal subdivision of wave (5) is unfolding as a 5 waves impulse Elliott Wave structure. Up from wave (4), wave ((i)) ended at 83.04, and pullback in wave ((ii)) ended at 82.34. Pair has resumed higher in wave ((iii)) towards 84.28, and dips in wave ((iv)) ended at 83.667. Final leg higher wave ((v)) of 1 ended at 84.488.
Pair then pullback and ended wave 2 at 83.4. It has turned higher in wave 3 and it is close to breaking above the previous wave 1 peak at 84.488. Break above that level should confirm the next leg higher in wave 3 has already started. Near term, expect wave ((i)) to end soon, then pair should pullback in wave ((ii)) before the rally resumes. As far as pivot at 83.4 low stays intact, expect wave ((ii)) dips to find support in 3, 7, or 11 swing for more upside.
AUDJPY 45 Minutes Elliott Wave Chart
Source: https://elliottwave-forecast.com/news/elliott-wave-view-audjpy-resumes-higher/