
More correction expected in the DXY as sellers continue to dominate
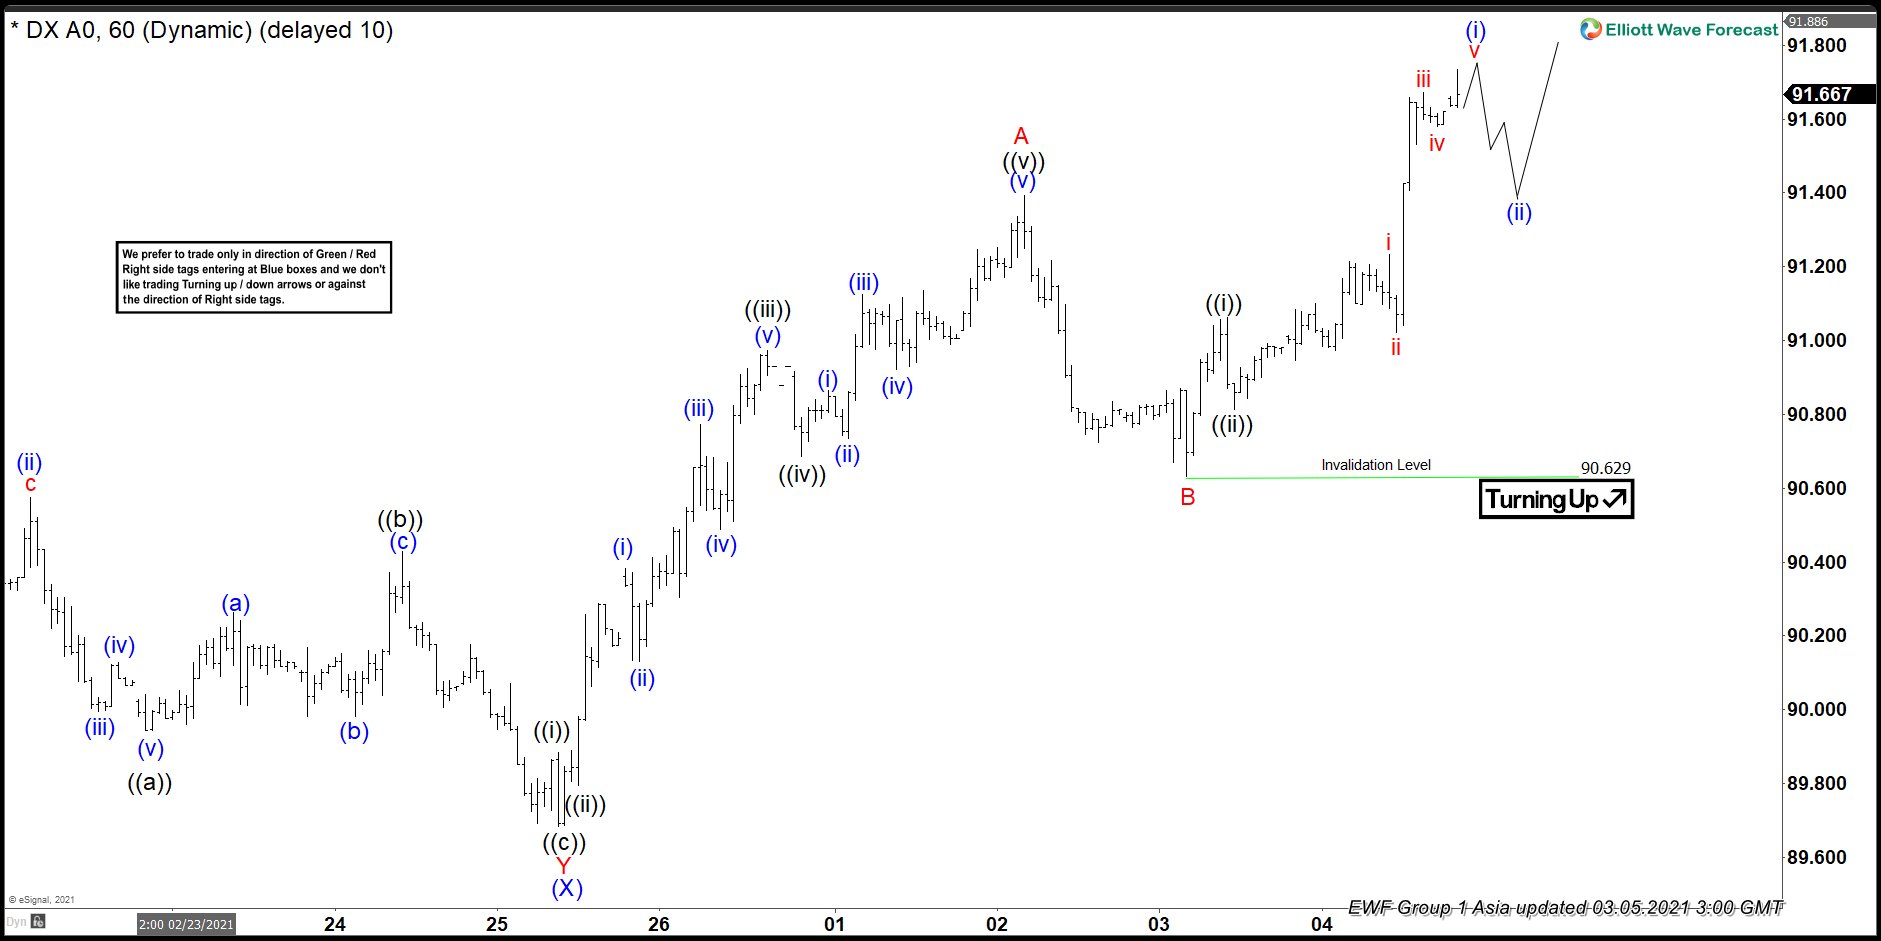
The DXY or the dollar index has been in a steady decline from the 102.97 levels. These levels were seen in March 2020. And since then, we have seen lower highs and lower lows to date. The recent low was set at 89.692 on 2/25/2021 as shown as (X) in the recent 1 hourly chart below. The series of lows appears to have been in impluse waves, and indeed the subdivisions would have also been just as impulsive. The right side is downside, therefore we prefer short positions.
Up from the January 6th lows, the index rallied in three waves and completed wave (W) in blue. We saw a decline in three more waves follow, as expected of a correction. This decline ended on February 25, at 89.682. Blue wave (W) and wave (X) both unfolded as double three corrections. Sometimes, these type of corretions can unfold as triple three corrections.
In the 1 hourly chart above, we regard the recent March 02 peak to have completed a minor degree A of wave (Y) of wave ((4)) . Internally, we saw subdivisions of five waves in red A – that is, ((i)) to ((v)) in black. We saw a three wave down in red wave B, correcting Red wave A. Up from the red wave B low, one can expect the upside rally to continue towards C, and thus (Y) and ((4)). If wave C does not unfold as an impulse, it may become an ending diagonal .One can expect wave ((4)) to terminate in the 92.097 and 93.595 area before sell-off resumes. Thereafter, we shall expect to see the beginning of a decline in wave ((5)).
Source: https://elliottwave-forecast.com/forex/dxy-further-drop-soon/