
In this technical blog, we are going to take a look at the past performance of Daily Elliott Wave Charts of BABA, which we presented to members. In which, the BABA completed an impulse structure from December 2018 low & made a bigger pullback. Also, the right side tag pointed higher & favored more strength. Therefore, we advised our members to buy the dips in BABA in 3, 7, or 11 swings at the blue box areas. We will explain the structure & forecast below:
BABA Daily Elliott Wave Chart From 12.20.2020
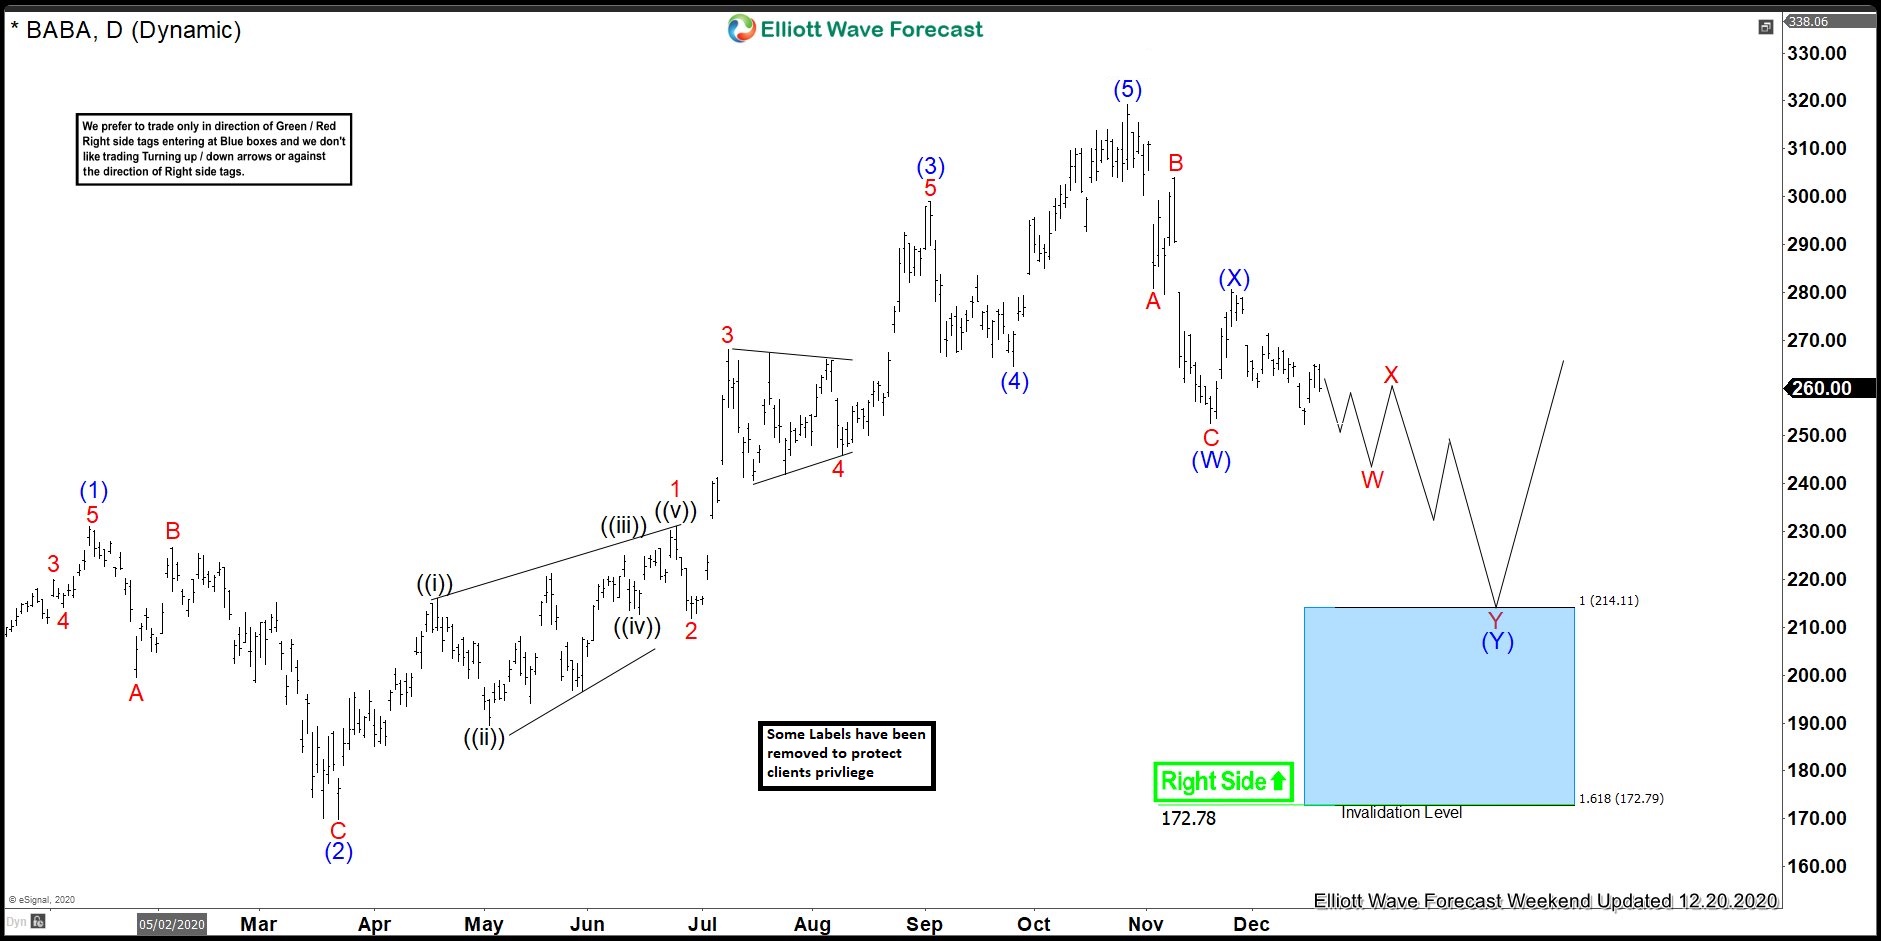
Here’s the Daily Elliott wave Chart of BABA from the 12/20/2020 Weekend update. In which, the stock ended the cycle from December 2018 low in an impulse structure & made a bigger pullback. The internals of that pullback unfolded as Elliott wave double three structure where first leg lower ended in wave (W) at $252.55 low. While wave (X) bounce ended at $280.61 high and wave (Y) was expected to reach $214.11- $172.79 100%-161.8% Fibonacci extension area of (W)-(X). Before providing a buying opportunity looking for more upside or for 3 wave reaction higher at least.
BABA Daily Elliott Wave Chart From 1.24.2021
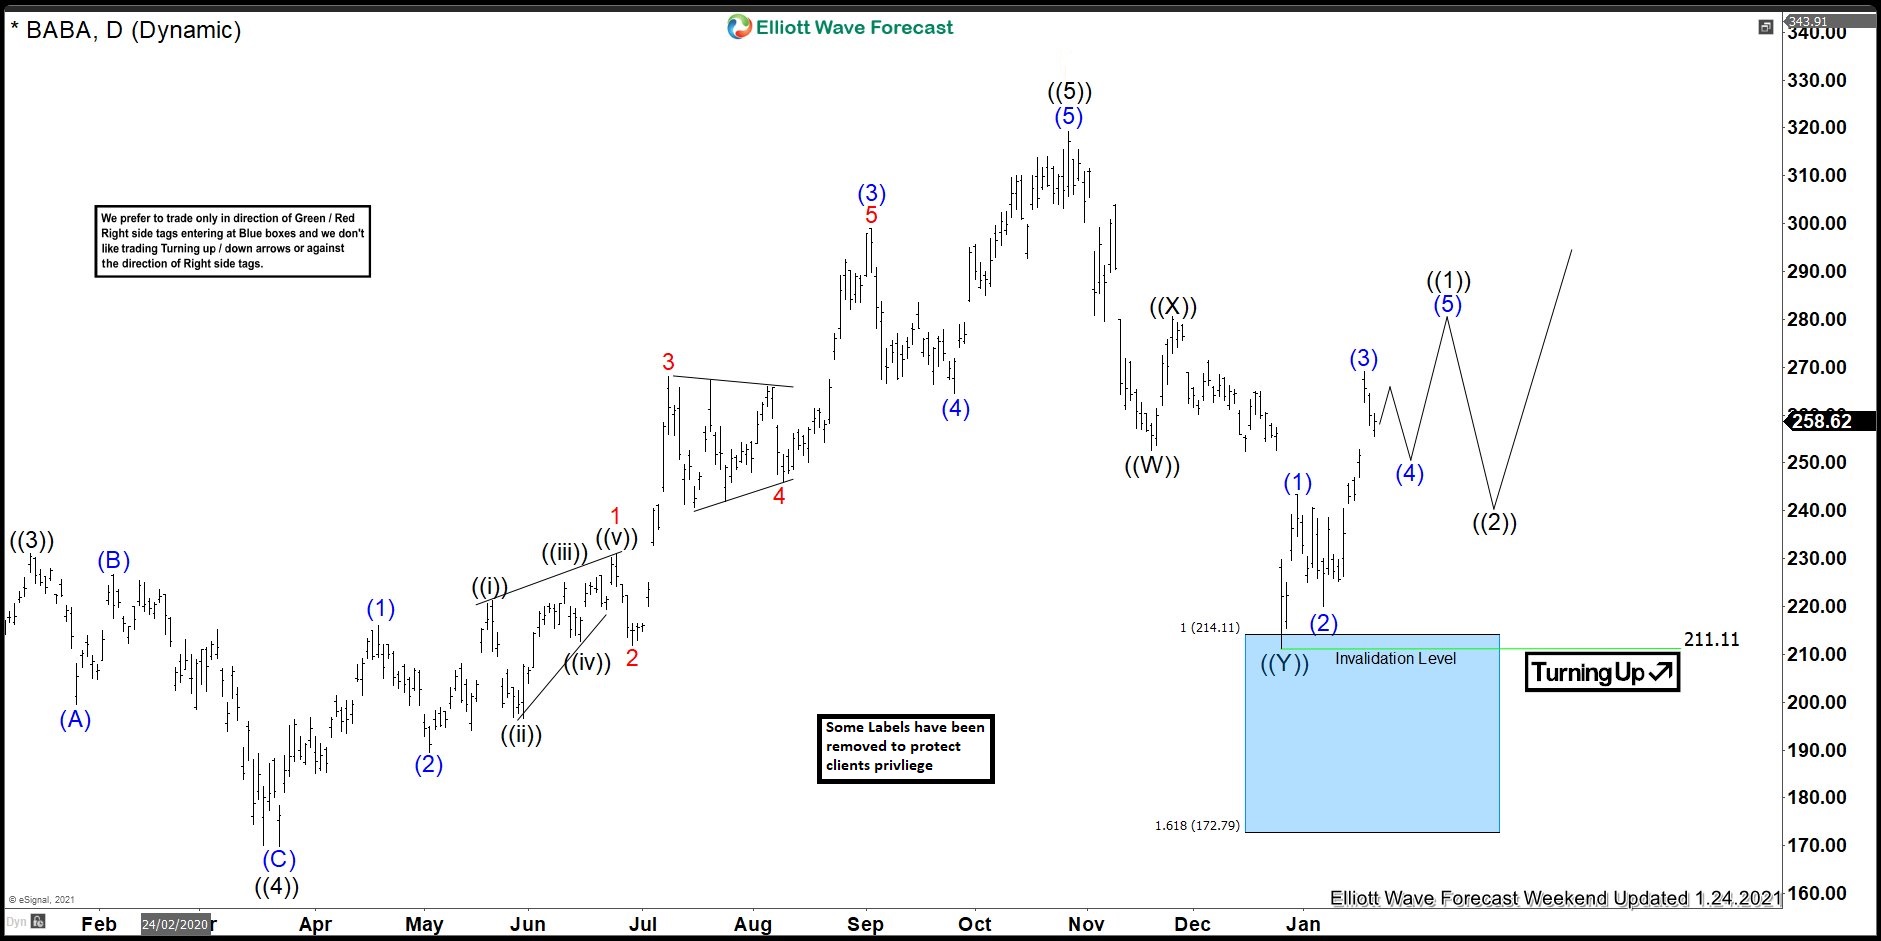
Here’s another Daily Chart of BABA from the 1/24/2021 update. In which the BABA managed to reach the blue box area at $214.11- $172.79 & showing reaction higher taking place from the blue box area. Allowed members to create a risk-free position shortly after taking the longs at the blue box area. However, a break above $319.32 high still needs to be seen to confirm the next extension higher & avoid double correction lower.
Source: https://elliottwave-forecast.com/stock-market/baba-forecasting-bounce-double-correction/