
Hello fellow traders. USDNOK is another instrument that has given us nice trading opportunity lately . As our members know the pair is bearish against the 9.6147 peak and recently it has found sellers in the recovery against the mentioned high. In this technical blog we’re going to take a quick look at the charts of USDNOK published in members area of the website and explain the Elliott Wave structure and trading strategy.
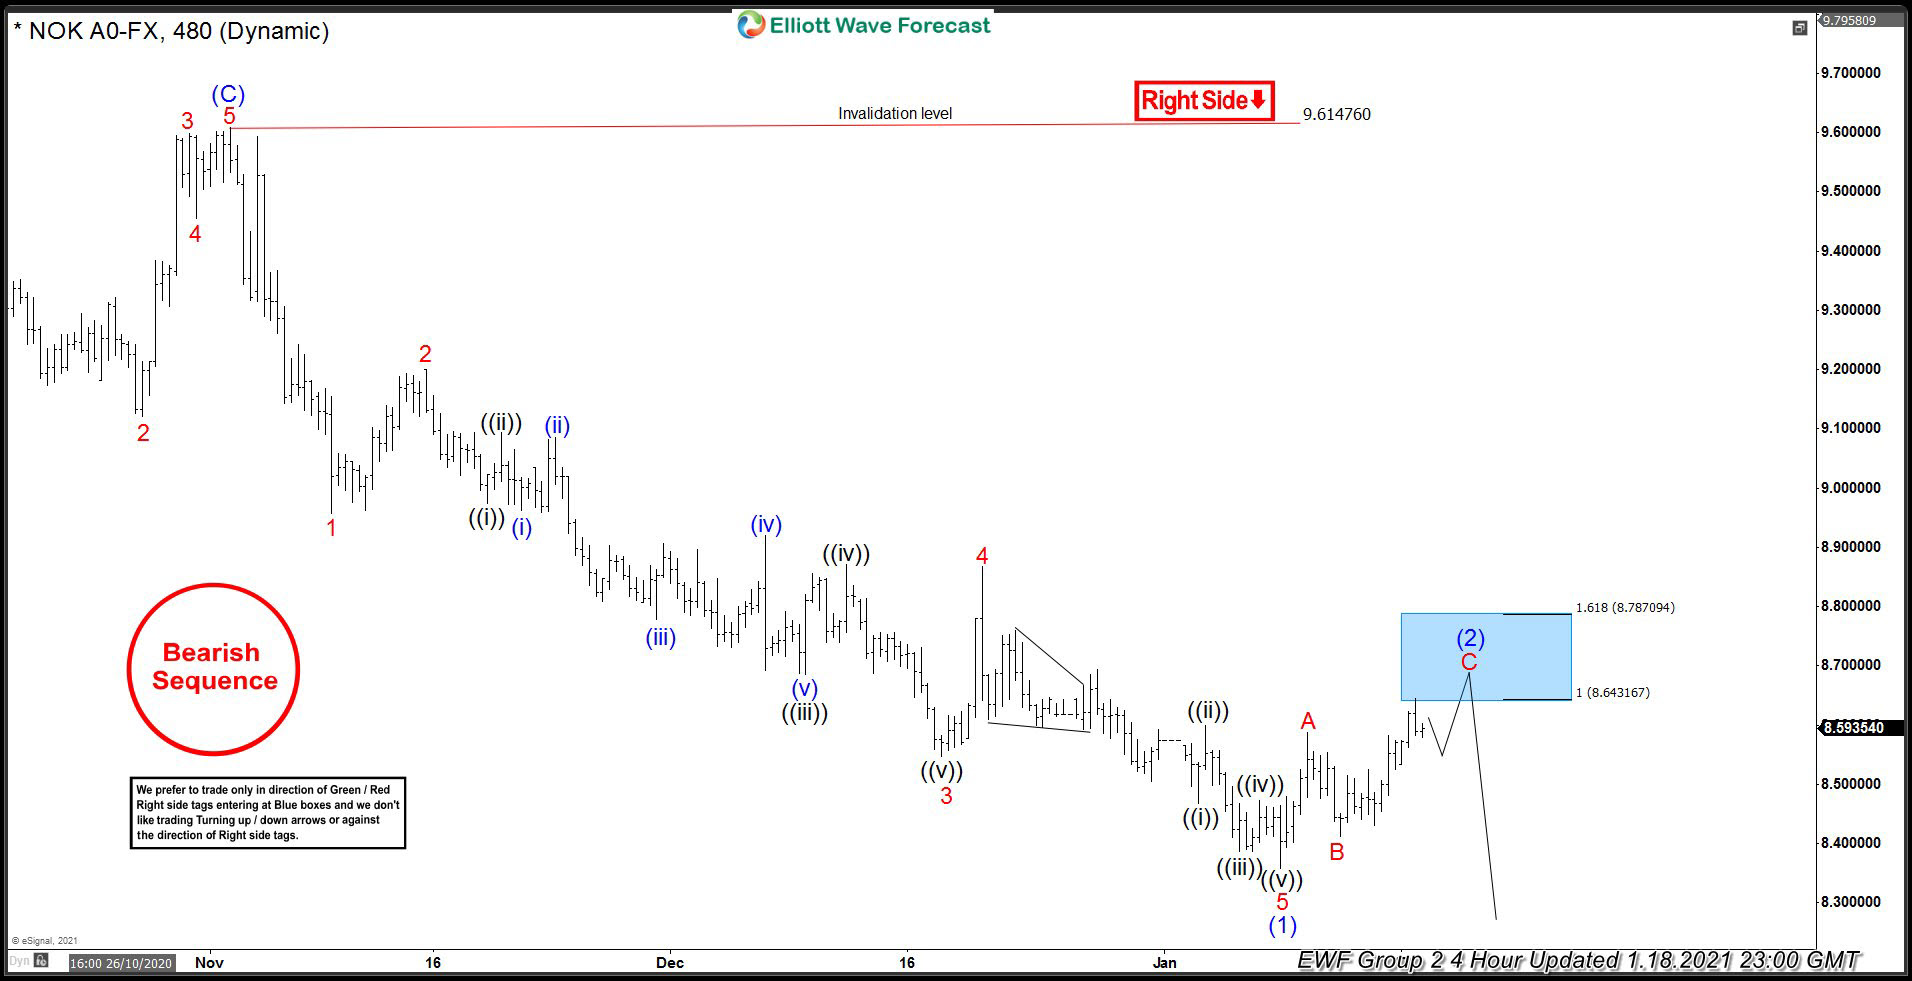
USDNOK Elliott Wave 4 Hour Chart 1.18.2021
Cycle from the 9.61476 peak shows 5 waves. Current view suggests The Pair is correcting the cycle from the 9.61476 peak. Recovery is having form of Elliott Wave Zig Zag Pattern that should ideally complete at 8.64316-8.78709 area . We should be aware that sellers zone is already reached and turn can happen any moment . At the Blue Box area sellers should ideally appear for decline toward new lows ideally. As the main trend is bearish we expect to see at least pull back from the marked zone. Once the price reaches 50 fibs against the B red low, we should make short positions risk free. As our members know Blue Boxes are no enemy areas , giving us 85% chance to get a reaction.
You can learn more about Elliott Wave Zig Zag Patterns at our Free Elliott Wave Educational Web Page.
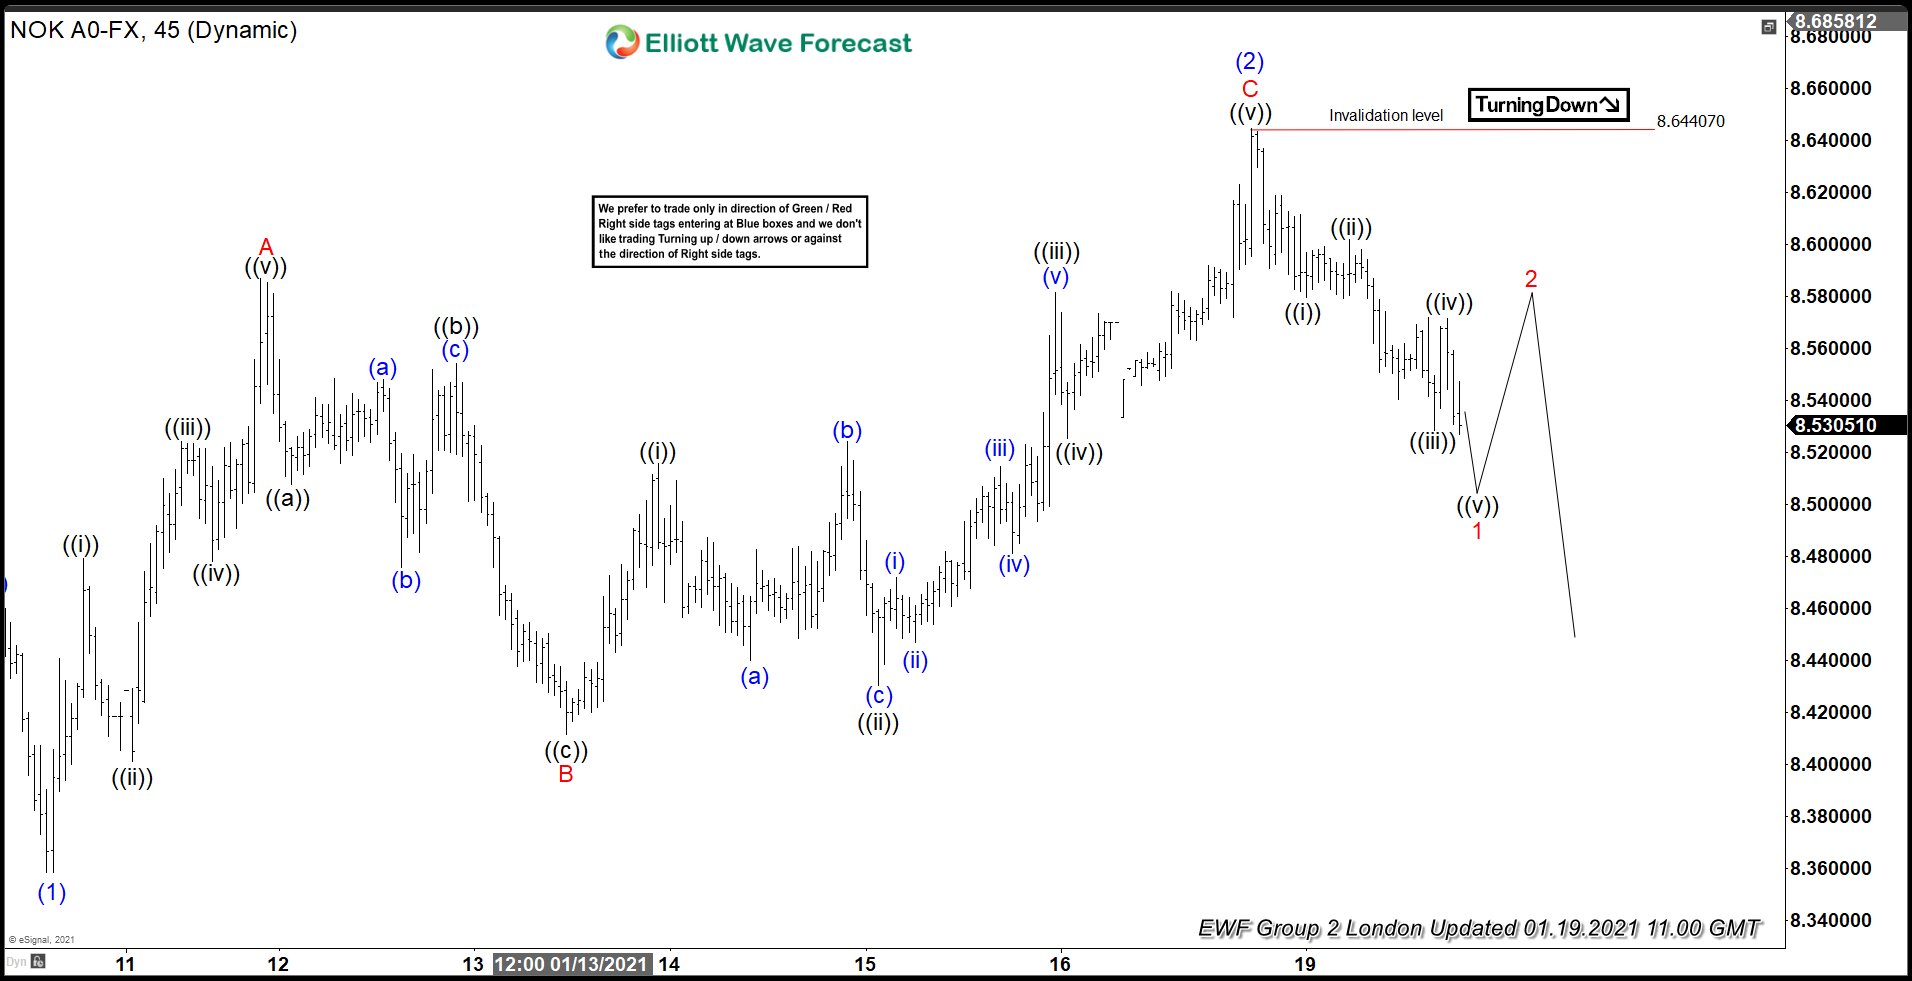
USDNOK Elliott Wave 1 Hour Chart 1.19.2021
USDNOK found sellers right at the blue box : 8.64316-8.78709 area. The pair gave us nice decline from there. At the moment the price has already reached 50 fibs against the B red low. Members who sold the pair at the blue box area now enjoying profits in a risk free trades. Now, we expect to see further separation down from the 8.64407 peak . We would need to see break of 01/8 low to confirm next leg down is in progress.
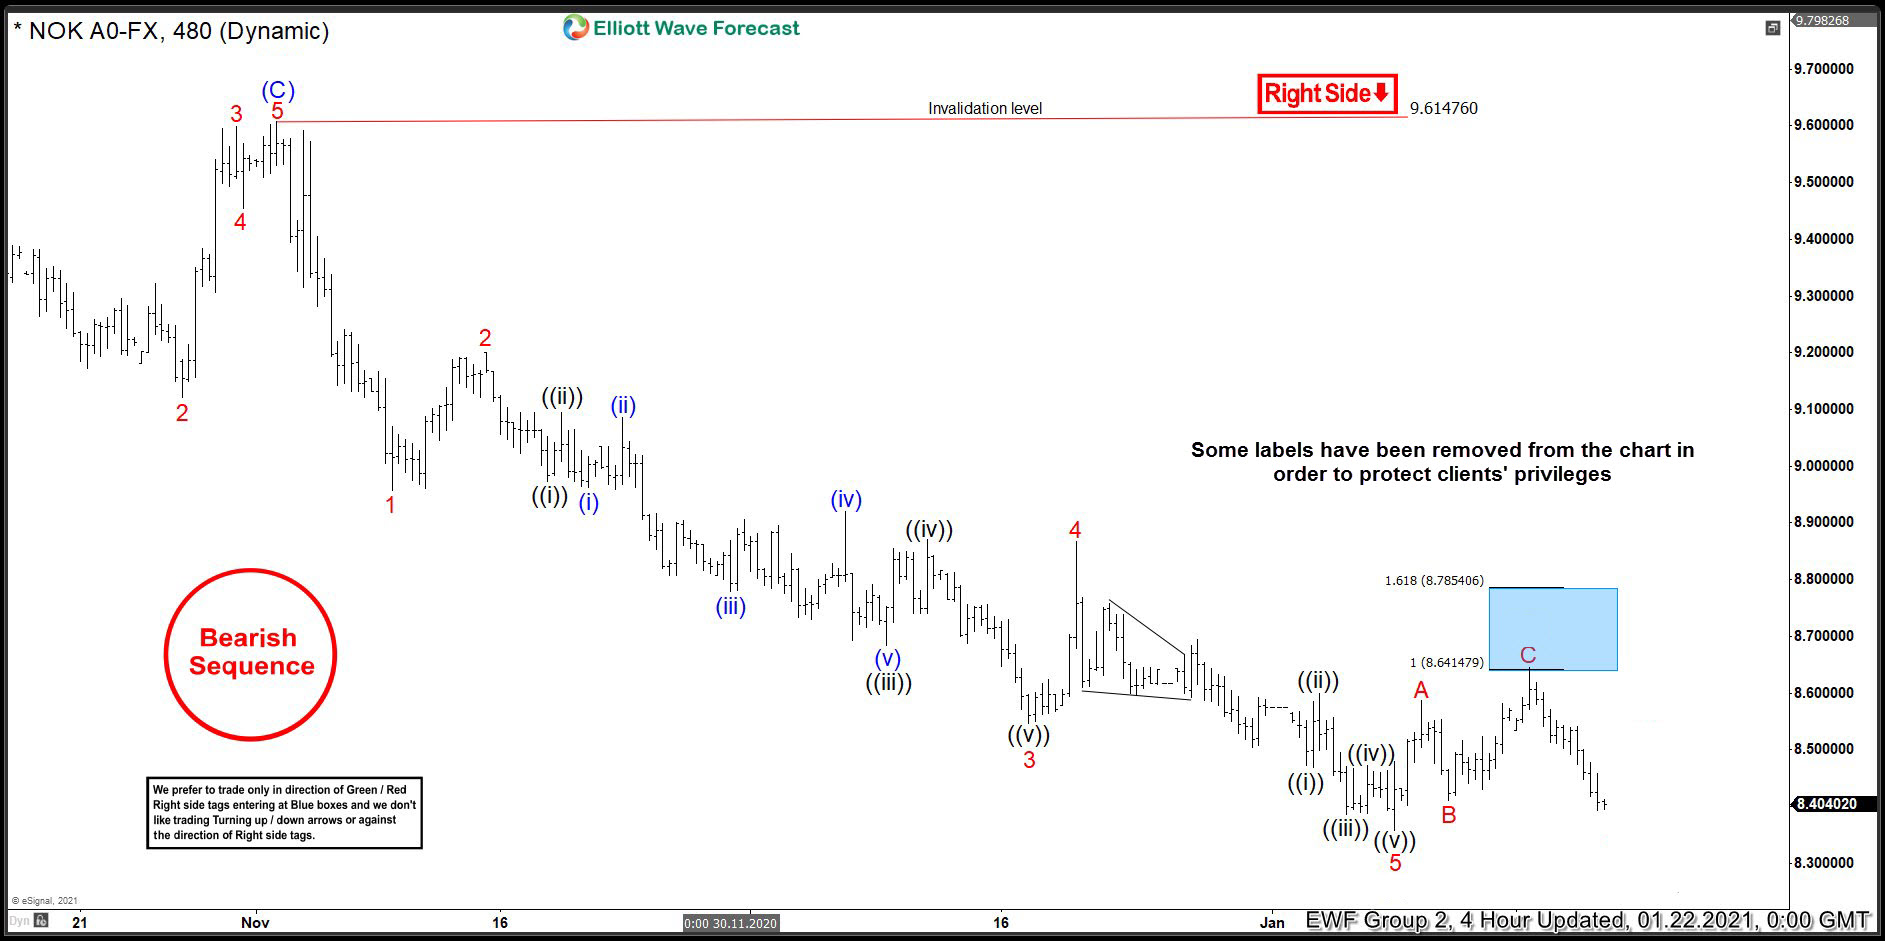
USDNOK Elliott Wave 4 Hour Chart 1.22.2021
As we can see on the chart below, the pair made nice decline from the blue box. We should be aware until the pair breaks below 01/8 low, it still can make 7 swings up against the 9.6147 peak.
Keep in mind market is dynamic and presented view could have changed in the mean time. You can check most recent charts in the membership area of the site. Best instruments to trade are those having incomplete bullish or bearish swings sequences.We put them in Sequence Report and best among them are shown in the Live Trading Room.
Source: https://elliottwave-forecast.com/trading/usdnok-found-sellers-blue-box-zone/