
Adidas is a German multinational corporation designing and manufacturing shoes, clothing and accessories. Created in 1934 by Adolf Dassler and headquartered in Herzogenaurach, Germany, the company is the largest sportswear manufacturer in Europe. Adidas is a part of both DAX30 and of SX5E indices. From the all-time lows, Adidas is showing a strong bullish behavior. In particular, from the 2008 lows it has gained more than 10x in value. In this blog, we show that the rally should continue.
Adidas Monthly Elliott Wave Analysis 01.17.2021
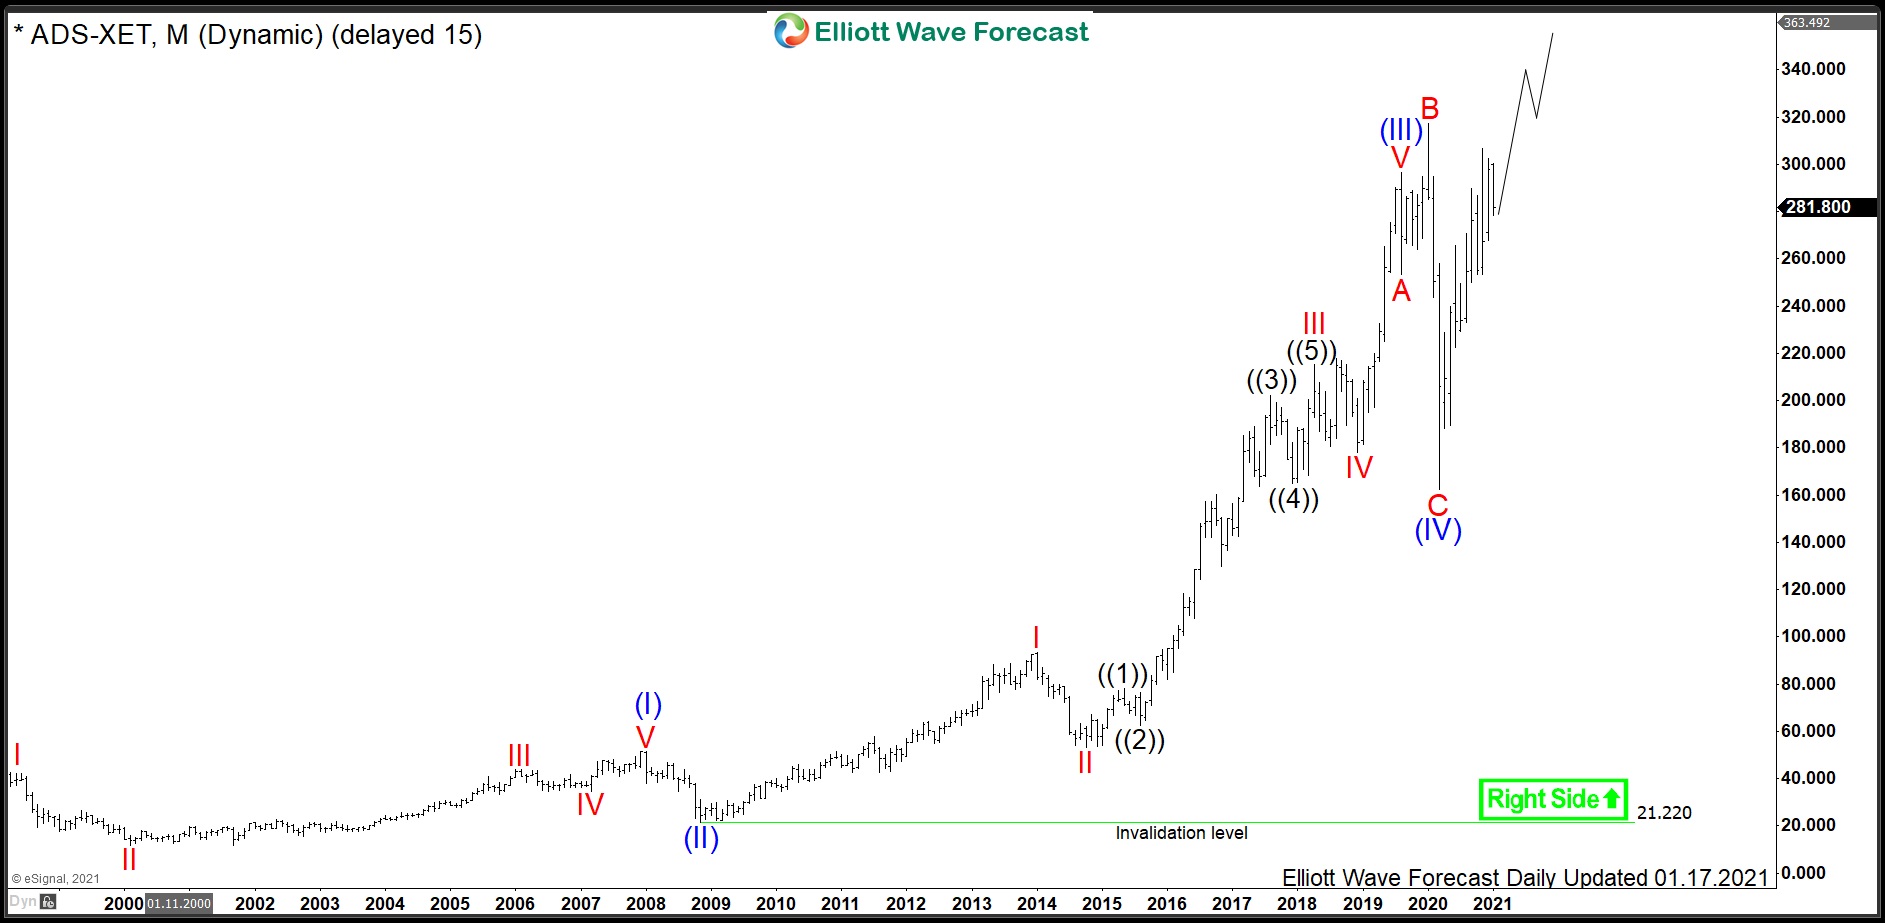
The monthly chart below shows the Adidas stock $ADS traded at XETRA. From the all-time lows, the stock price has developed a cycle higher in blue wave (I) of super cycle degree towards January 2008 highs at 51.63. From there, a correction lower in blue wave (II) has retraced part of the rise. It has printed a bottom on November 2008 at 21.22. From November 2008 lows, a cycle in wave (III) has extended towards August 2019 highs at 296.75. Hereby, the extension beyond 4.236 qualifies the cycle as a 3rd wave. From the August 2019 highs, a correction lower in wave (IV) has unfolded as an expanded flat structure towards the March 2020 lows at 162.20.
From the March 2020 lows, a new cycle in wave (V) is in progress and should break to the new all-time highs. The minimum target higher is 328.80 which is based on the 1.236 inverse Fibonacci ratio as related to the length of the wave (IV). However, there is no sealing on the upside. Therefore, long-term investors can expect Adidas to remain strong and go far beyond 328.80 target.
Adidas Daily Elliott Wave Analysis 01.17.2021
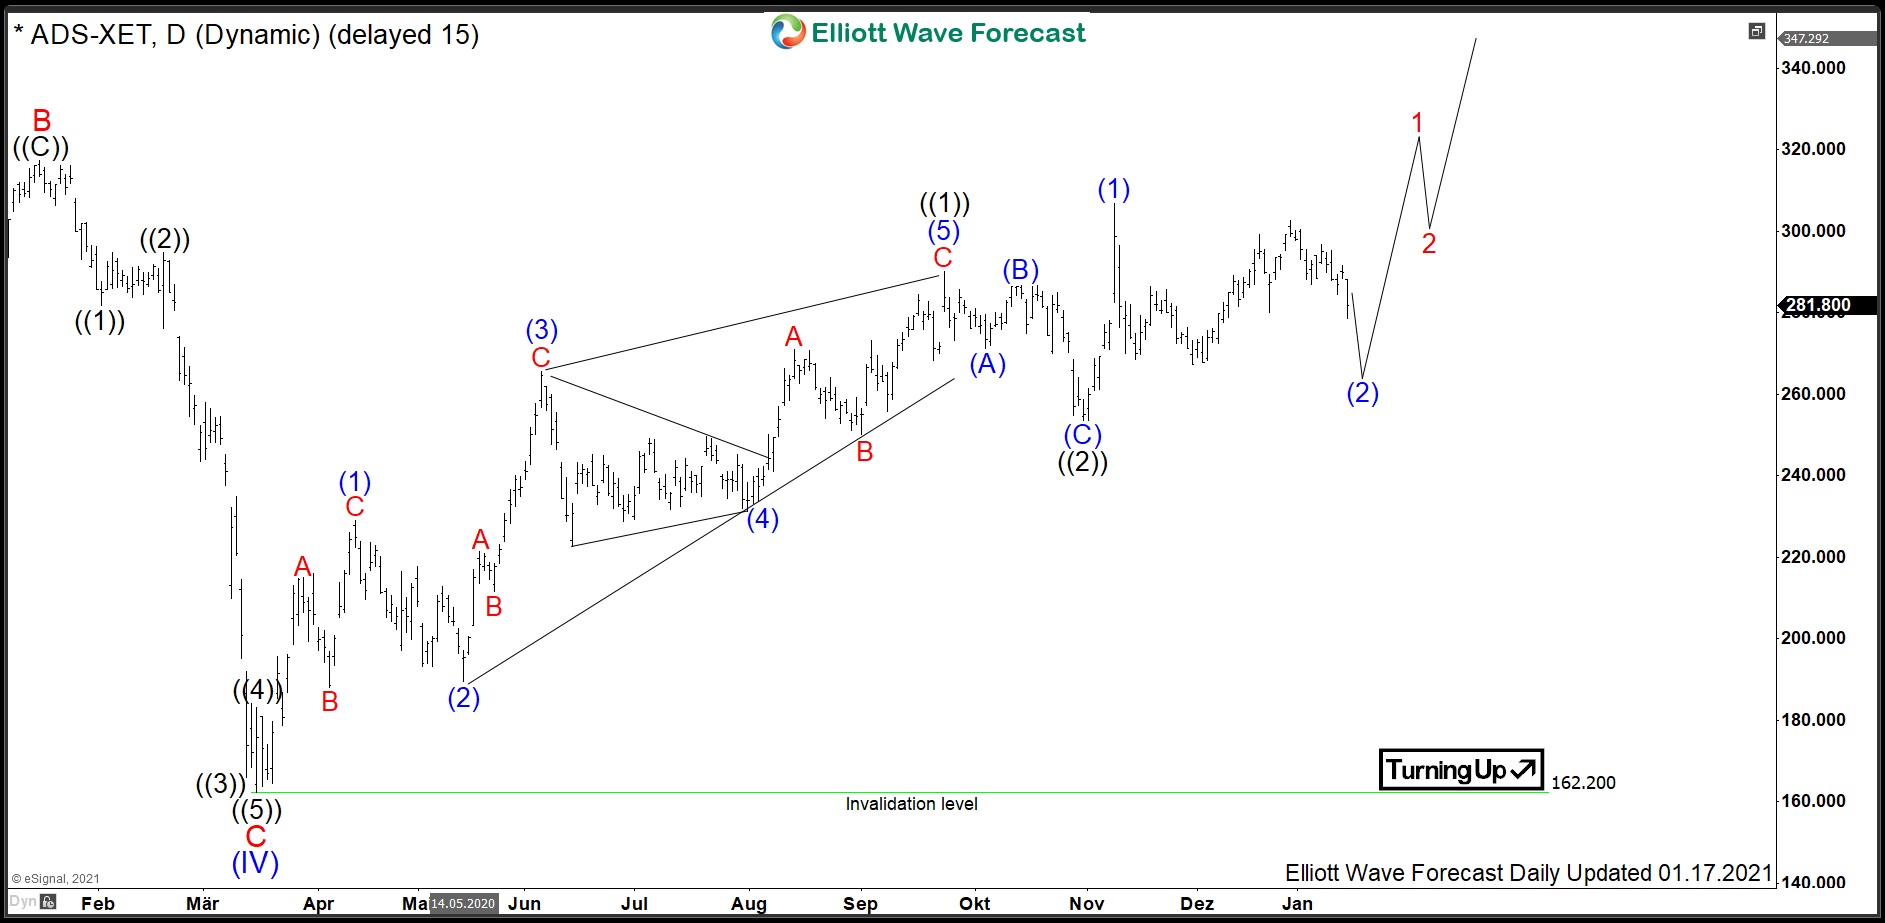
The daily chart below shows in more detail the advance higher in red wave I of blue wave (V). From the March 2020 lows at 162.20, a cycle higher in black wave ((1)) has unfolded as a leading diagonal. It has printed its top in September 2020 at 290.00. A correction lower in black wave ((2)) has been accomplished on 30th of October. Later on, a wave ((3)) higher has been confirmed by breaking above 290 highs. Now, while above 253.50, wave ((3)) can continue higher and reach towards 1.0-1.618 extension of the wave ((1)) being 380.03-458.35 and even higher in case of an impulse in wave I. On the other hand, a diagonal in wave I can provide a more conservative target which is 0.618-0.786 extension of the wave ((1)) being 331.62-352.91.
Source: https://elliottwave-forecast.com/stock-market/adidas-stock-continue-jogging-higher/