Hello fellow traders. In this technical blog we’re going to take a quick look at the Elliott Wave charts of Copper Futures ( $HG_F) published in members area of the Elliottwave-Forecast . As our members know, Copper is showing higher high sequences in the cycle from the March low ( 19720). Consequently , we recommended our members to avoid selling Copper in any pull back and keep on buying the dips in 3,7,11 swings whenever get chance. Recently we got short term pull back that has unfolded as Elliott Wave Double Three pattern. In further text we’re going to explain the forecast and Elliott Wave Pattern and trading strategy.
Before we take a look at the real market example, let’s explain Elliott Wave Double Three pattern.
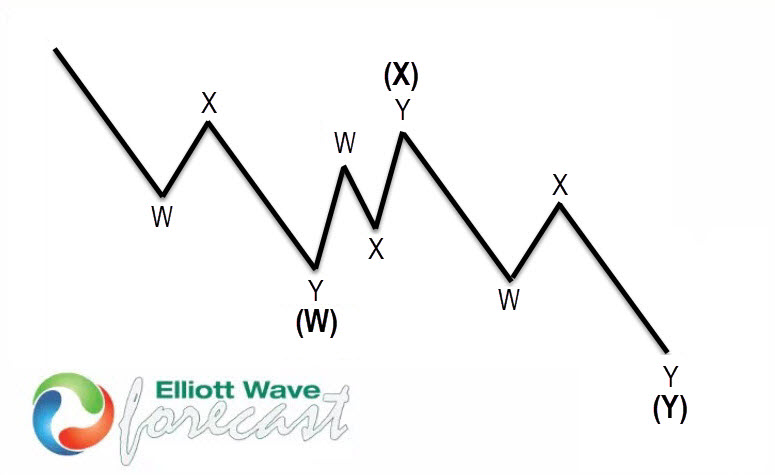
Elliott Wave Double Three Pattern
Double three is the most important and common pattern in the market these days, also known as 7 swing structure.
It’s a very reliable pattern which is giving us good trading entries with clearly defined invalidation levels and target areas.
The picture below presents what Elliott Wave Double Three pattern looks like. It has (W),(X),(Y) labeling and 3,3,3 inner structure, which means all of these 3 legs are corrective sequences. Each (W) and (Y) are made of 3 swings , they’re having A,B,C structure in lower degree, or alternatively they could have W,X,Y labeling.
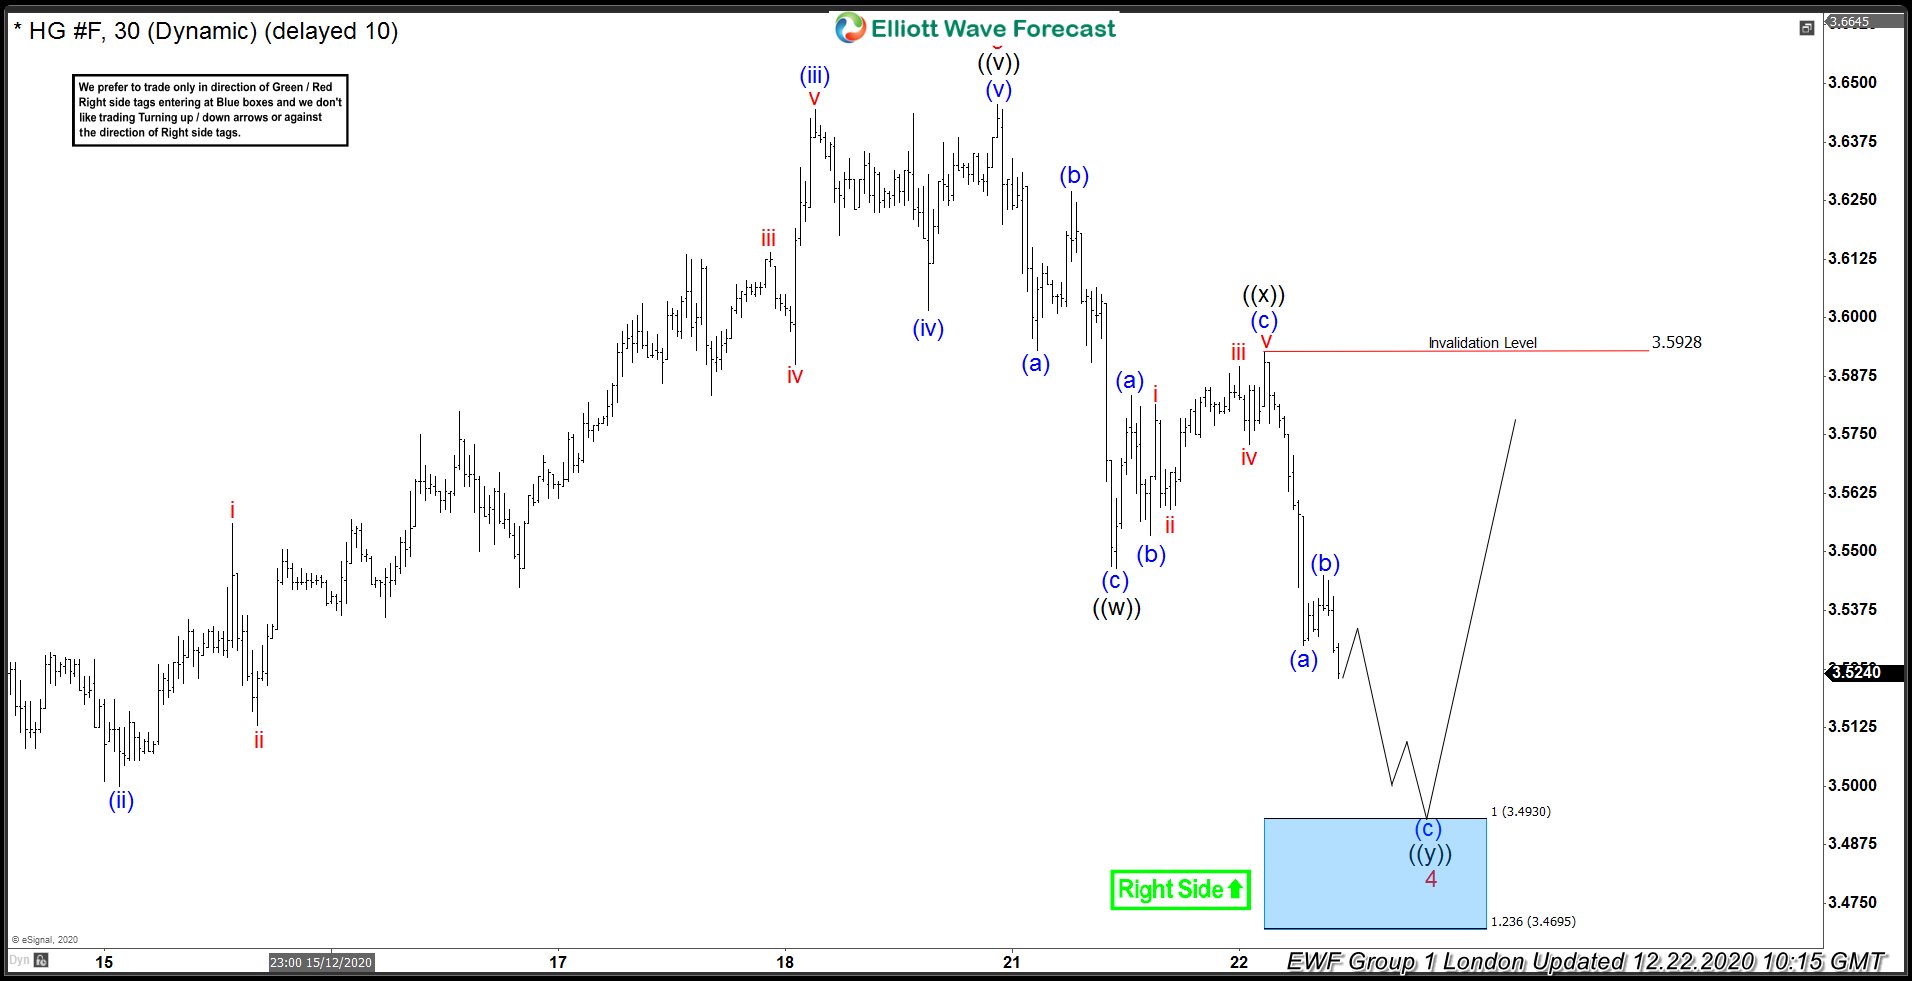
Copper 1 Hour Elliott Wave Analysis 12.22.2020
Copper Short term pull back is unfolding as Elliott Wave double three pattern with inner labeling: ((w))((x))((y)) black. Each leg of the pull back has corrective structure. Pull back has incomplete sequences at the moment. Due to lower low structure we call for more short term weakness toward 3.4930-3.4695 area ( blue box- buyers zone) .We don’t recommend selling it. Strategy is buying the dips at the marked blue box area. As Copper is bullish against the 3.0337 low, we expect to see 3 waves bounce at least from the mentioned zone. As soon as the price reach 50 Fibonacci Retracement against the ((x)) black peak (3.5928), we should make long positions Risk Free ( put SL at BE).
You can learn more about Elliott Wave Double Three Patterns at our Free Elliott Wave Educational Web Page.
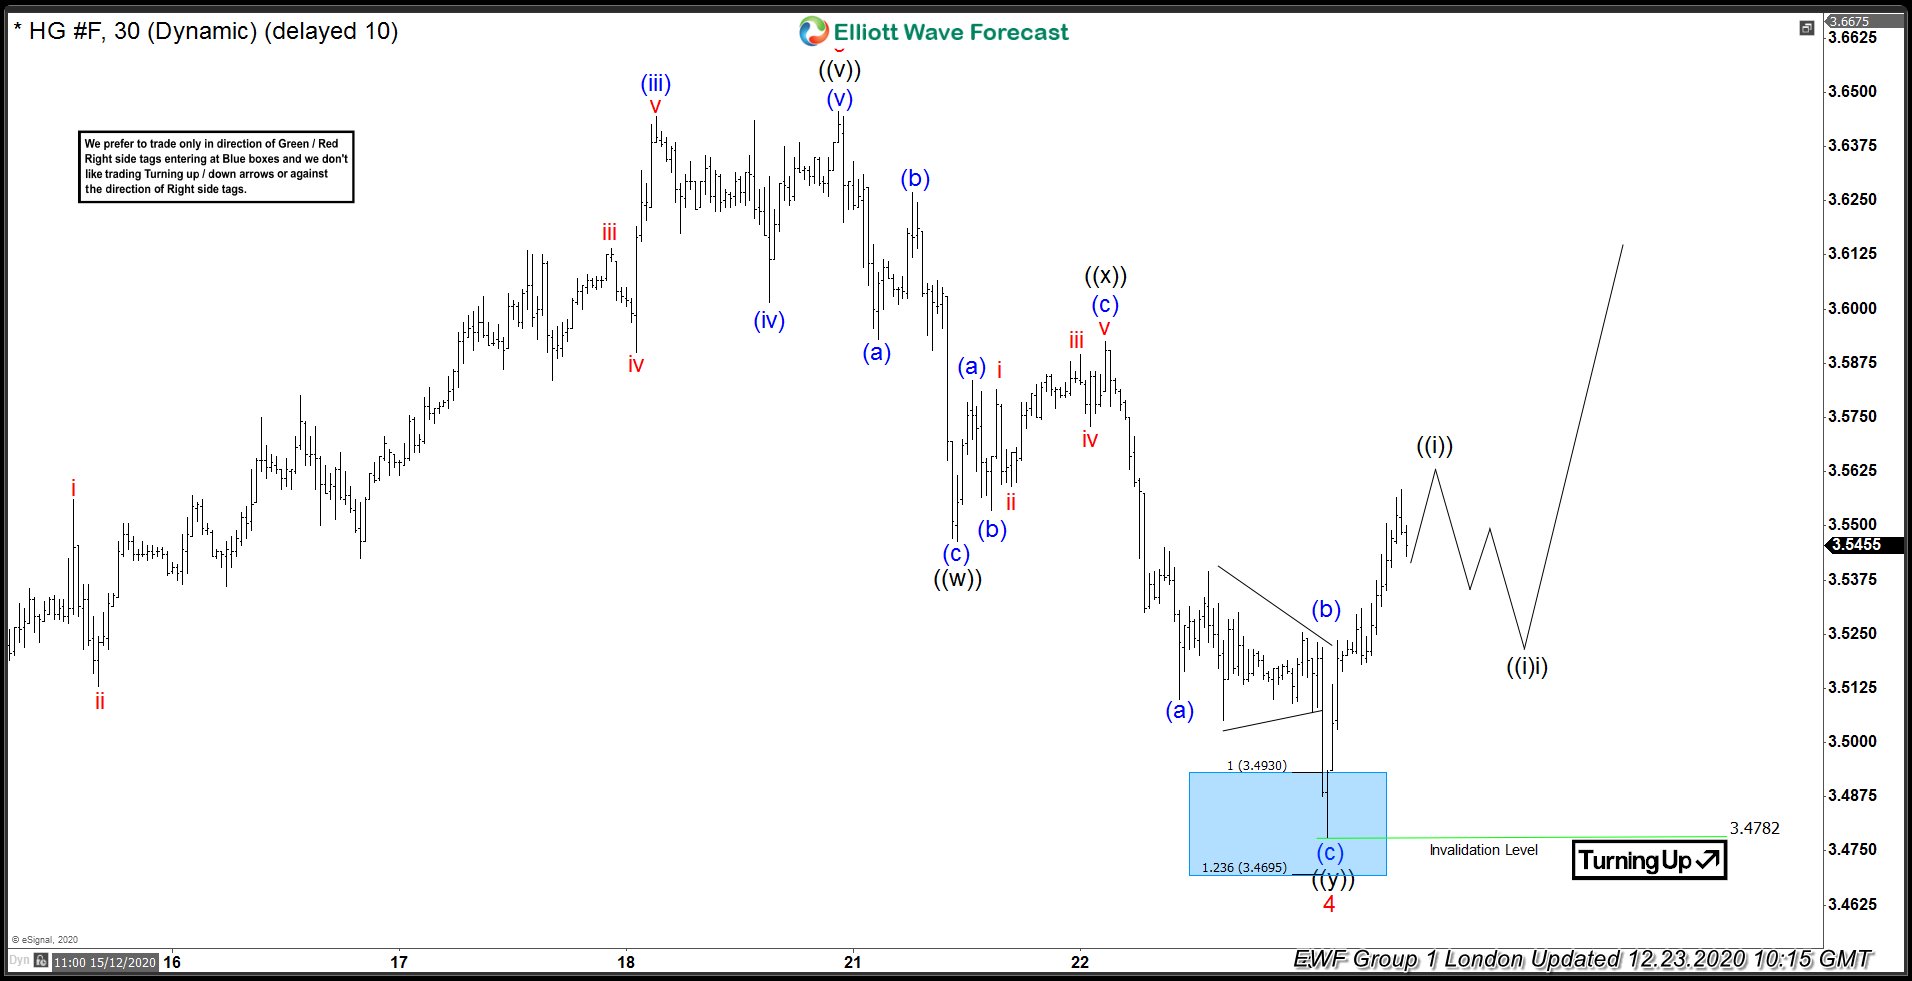
Copper 1 Hour Elliott Wave Analysis 12.23.2020
Copper made proposed extension down and reached buyers zone. At this moment we can count clear 7 swings down from the peak, when pull back 4 red ended at 2.4782 low as Elliott Wave Double Three Pattern. Copper found buyers at blue box: 3.4930-3.4695 area . The bounce already reached 50 fibs against the ((x)) high, so all long positions should be risk free at this stage. Current view suggests we can be ending short term cycle from the 3.478 low as ((i)) black. We expect to see 3 waves pull back ((ii)) black, and further rally.
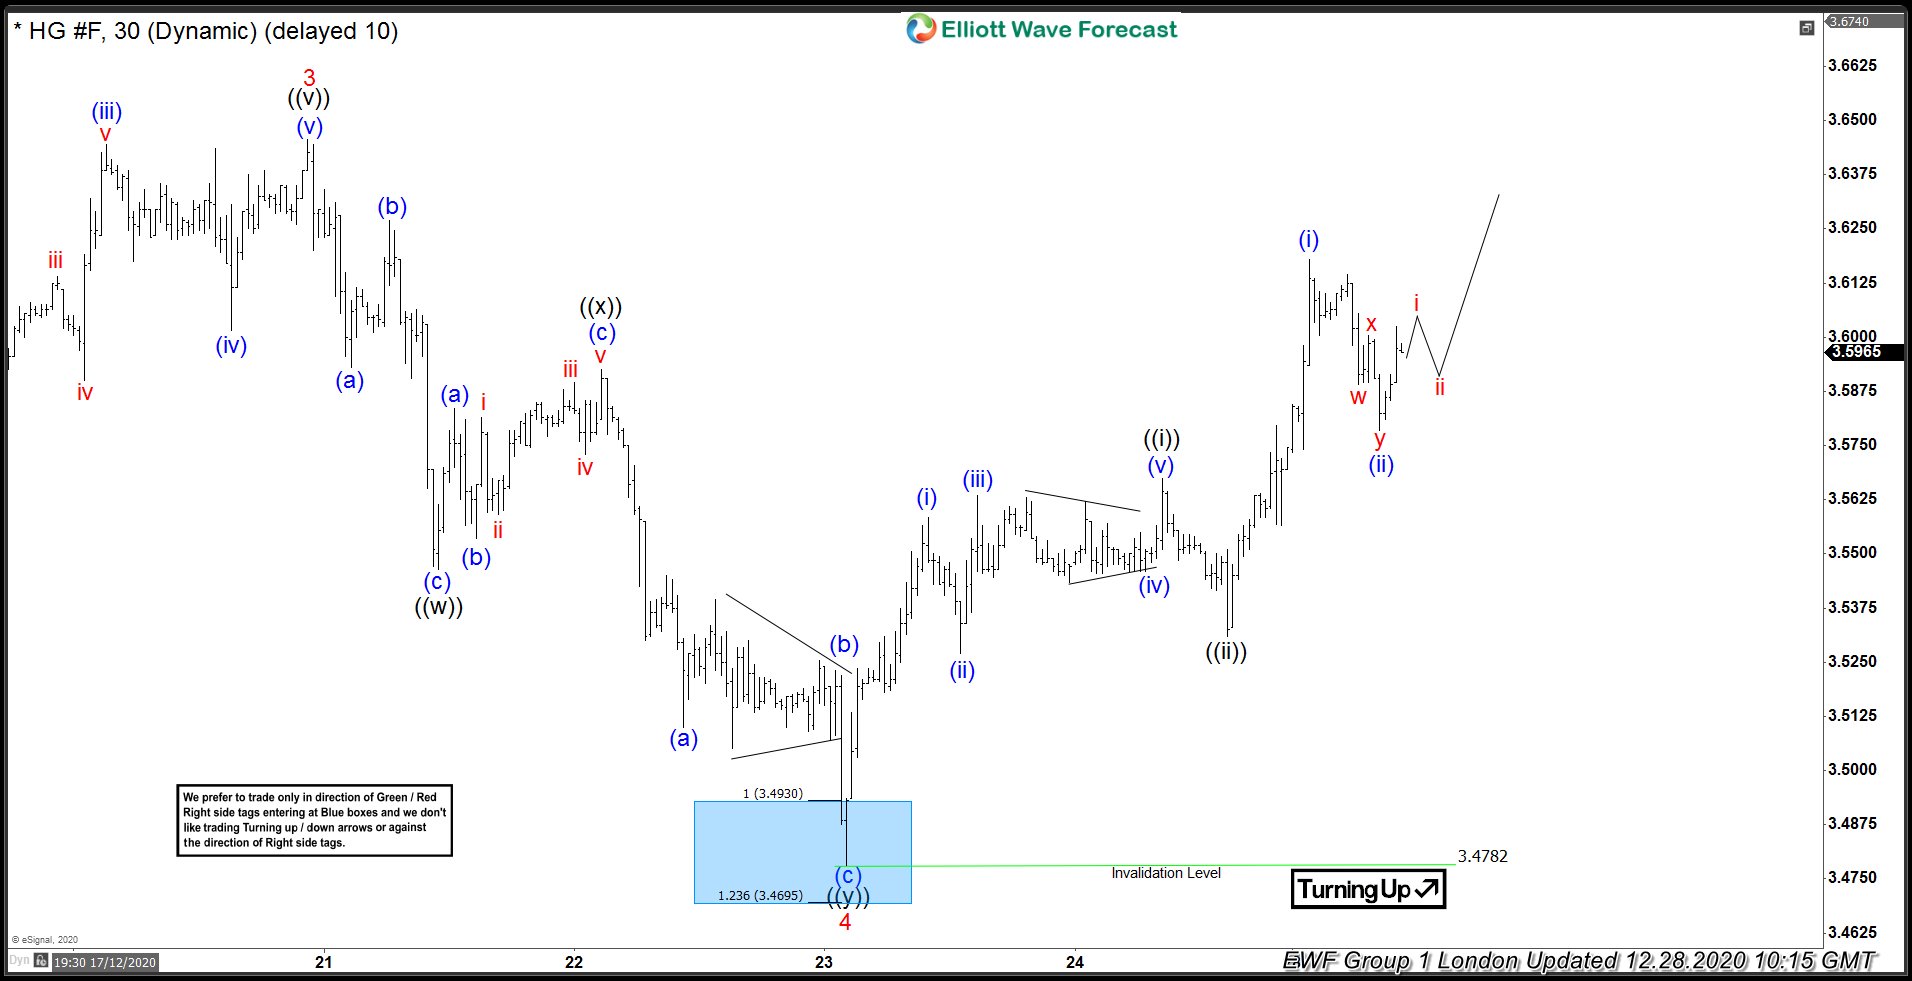
Copper 1 Hour Elliott Wave Analysis 12.28.2020
Eventually we got 3 waves pull back in ((ii)) and further rally as expected. Now we would like to see break above 3 red in order to confirm next leg up is in progress.
Keep in mind that market is dynamic and presented view could have changed in the mean time. Best instruments to trade are those having incomplete bullish or bearish swings sequences. We put them in Sequence Report and best among them are shown in the Live Trading Room. You can check most recent charts in the membership area of the site.
Source: https://elliottwave-forecast.com/elliottwave/copper-hg_f-buying-elliott-wave/