
Many times, we hear in the argot of technical analysis the term “Equal Legs”, which sounds very strange and does not make sense to the world of finance. However, this term is especially important when making a forecast of the future movements of the different market instruments, because when the market reaches the equal legs, it has a high probability that the market will correct or change trend.
Looking for Equal Legs
Equal legs are simply the 100% Fibonacci extension, where wave A and wave B are taken to find a possible ending of wave C. The problem lies in correctly identifying A and B, being A and B any type of valid structure according to the Elliott Wave rules. To learn more about Elliott Wave Theory, follow this link: Elliott Wave Theory). Let’s see some examples:
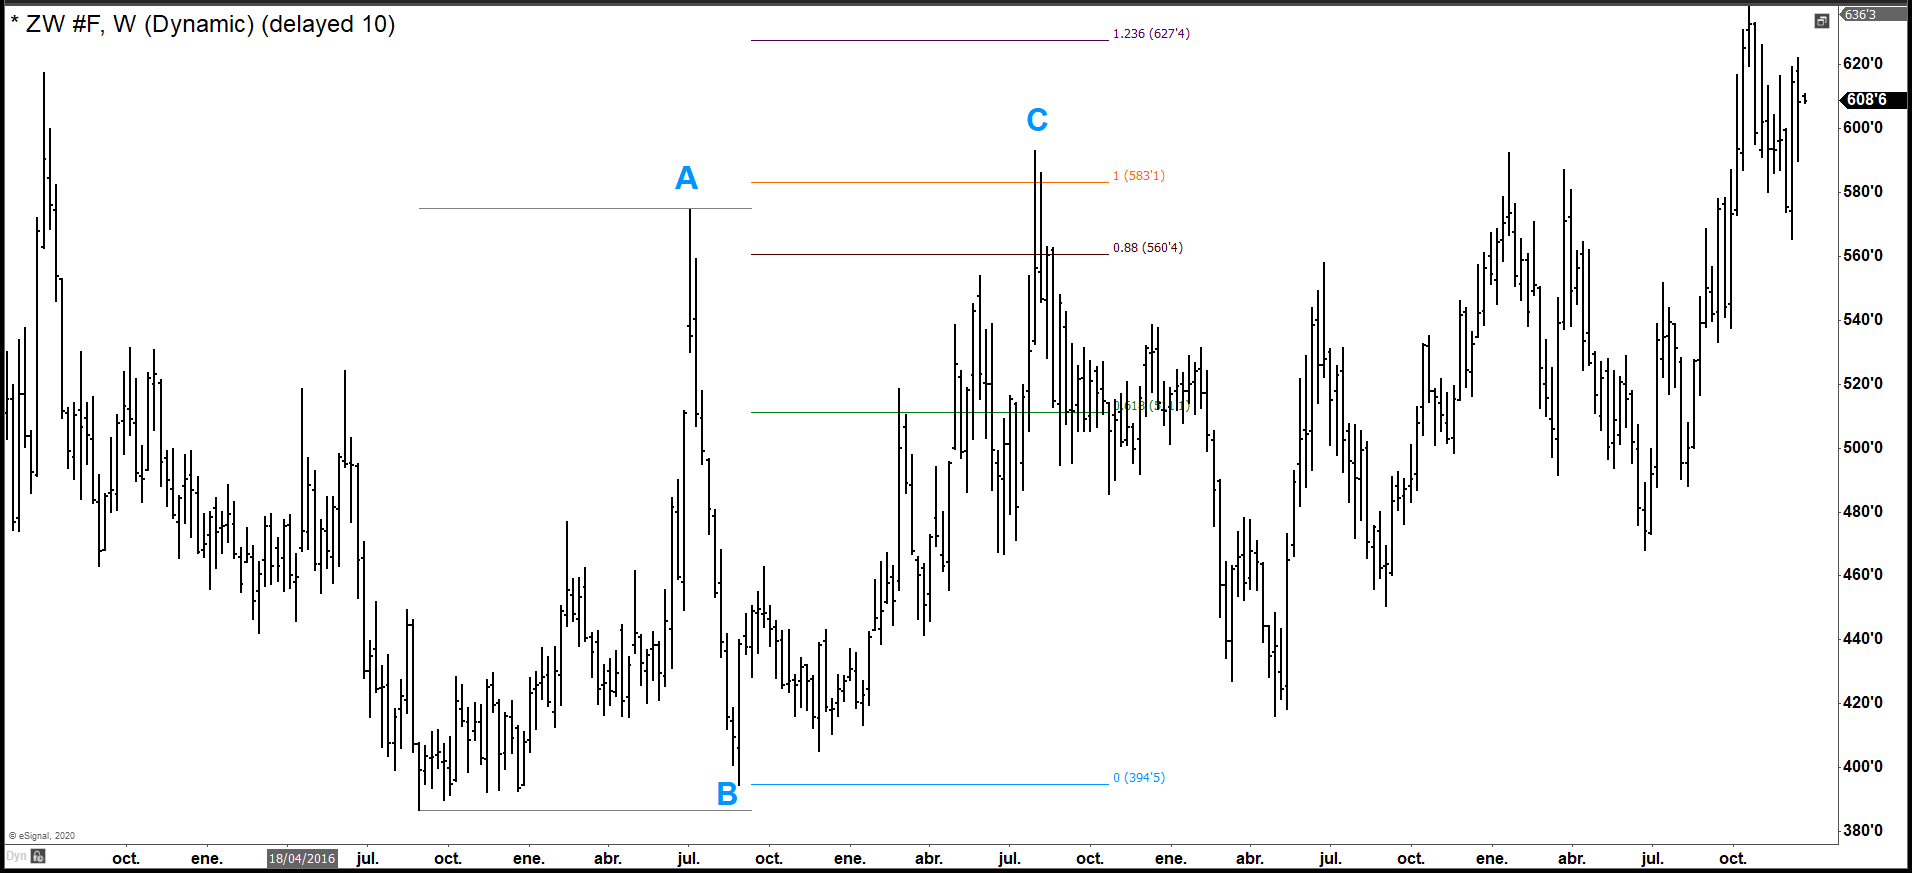
In this first example we can see Wheat on the weekly chart with a two years ABC structure. Upon reaching 100% Fibonacci, the market reacts downwards making a correction and then continue with the trend.
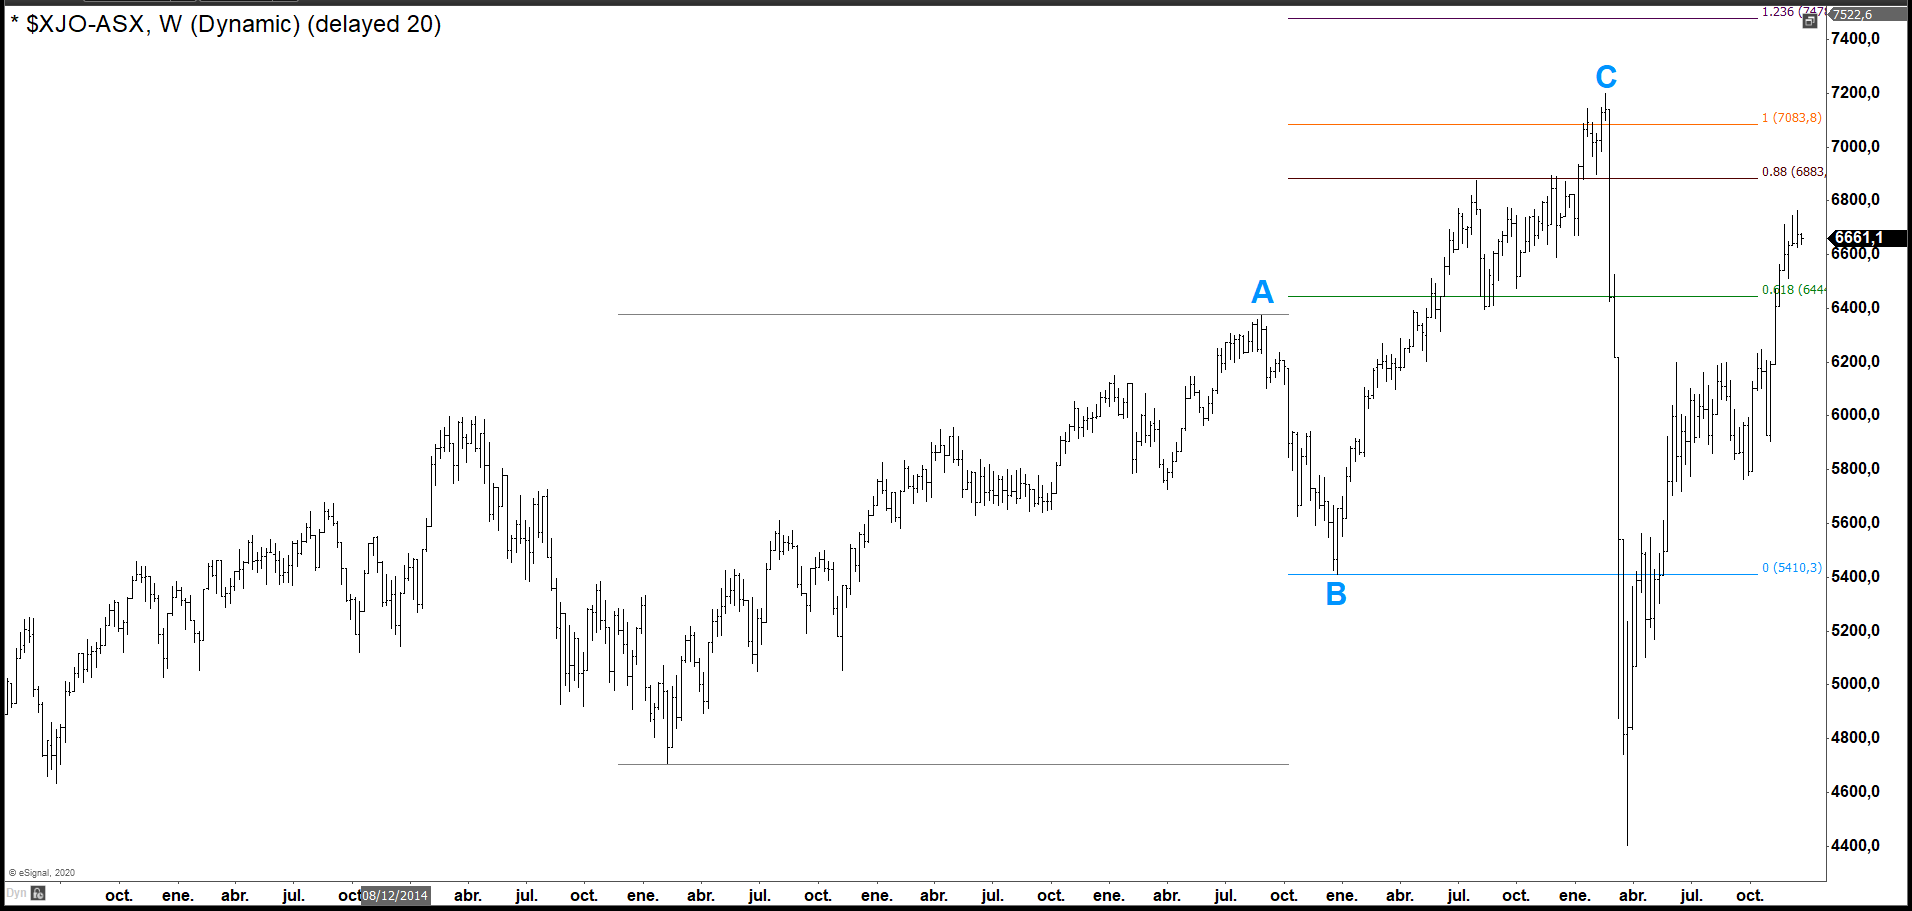
In the second example we have the Australian Index weekly chart where the market reached the equal legs just before the bearish movement due to the coronavirus pandemic. It should be noted that the equal legs should not be perfect, but a close level as we have seen so far.
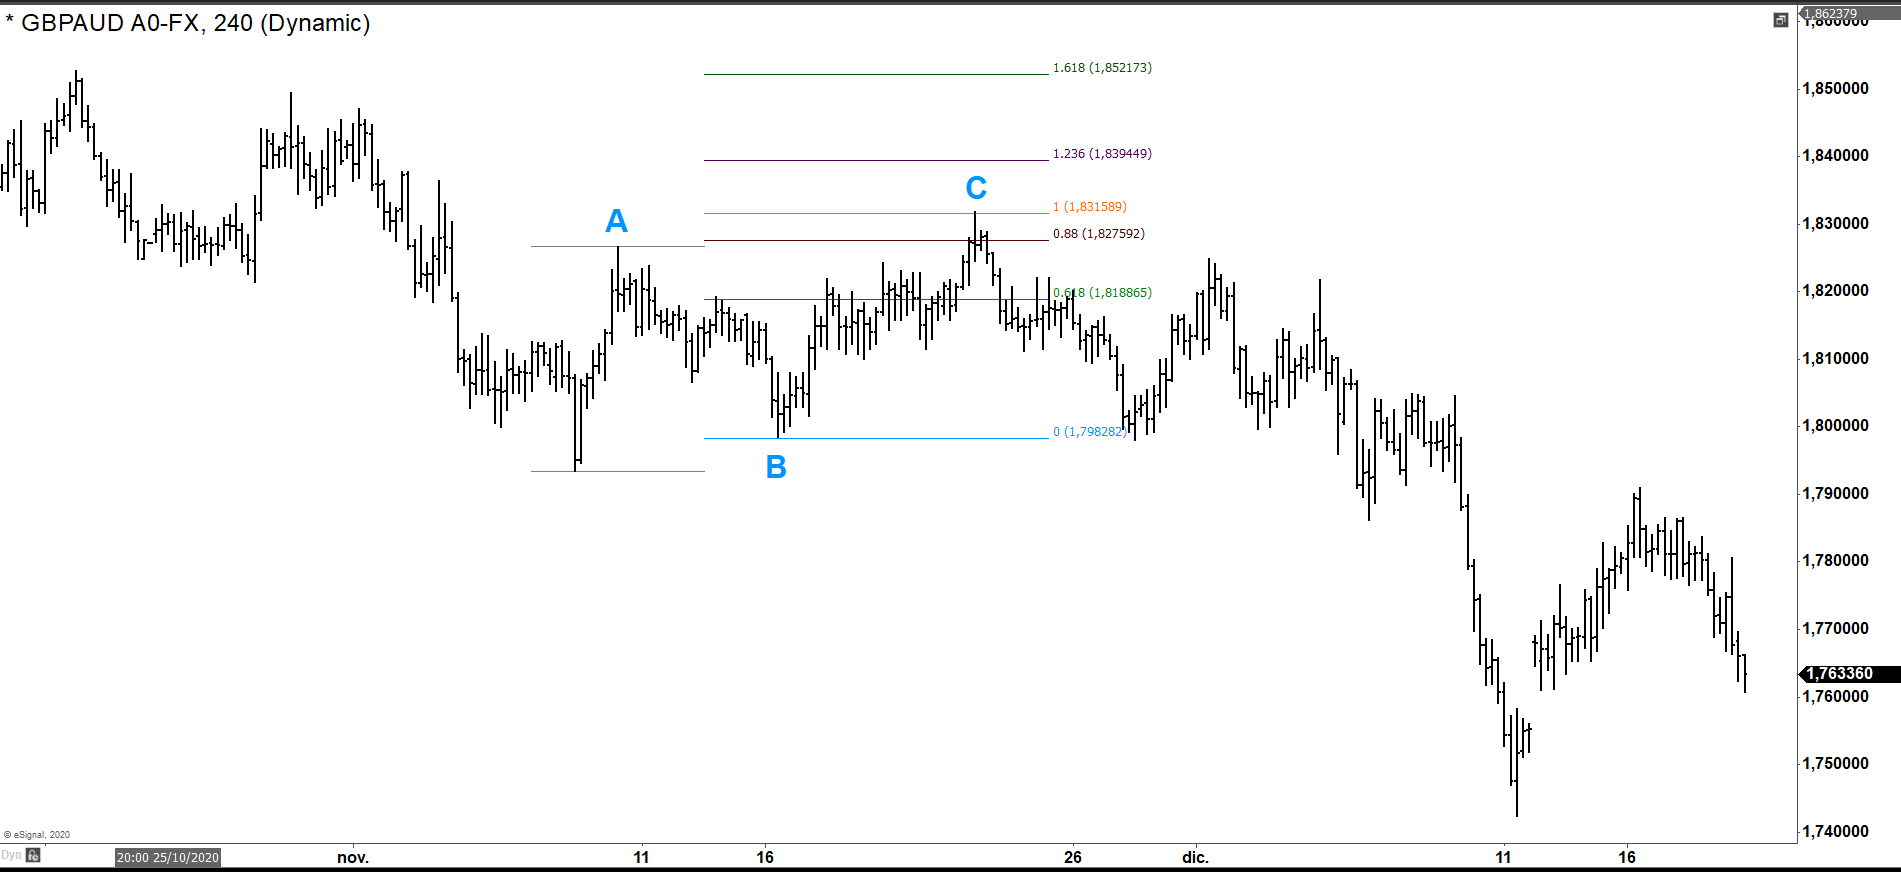
And finally, in this third example we have the GBPAUD where we see a 100% perfect extension to then continue to the downside.
Source: https://elliottwave-forecast.com/elliottwave/equal-legs-elliotts-wave-theory/